MY ROLE
Principal product designer.
Research, user journey, wireframing, prototyping, user testing, UI design, design systems, icons and illustrations, visual design, branding design.
Principal product designer.
Research, user journey, wireframing, prototyping, user testing, UI design, design systems, icons and illustrations, visual design, branding design.
TOOLS
Sketch App, Adobe Illustrator, Adobe Photoshop, InVision, Jira, Confluence.
Sketch App, Adobe Illustrator, Adobe Photoshop, InVision, Jira, Confluence.
INTRO
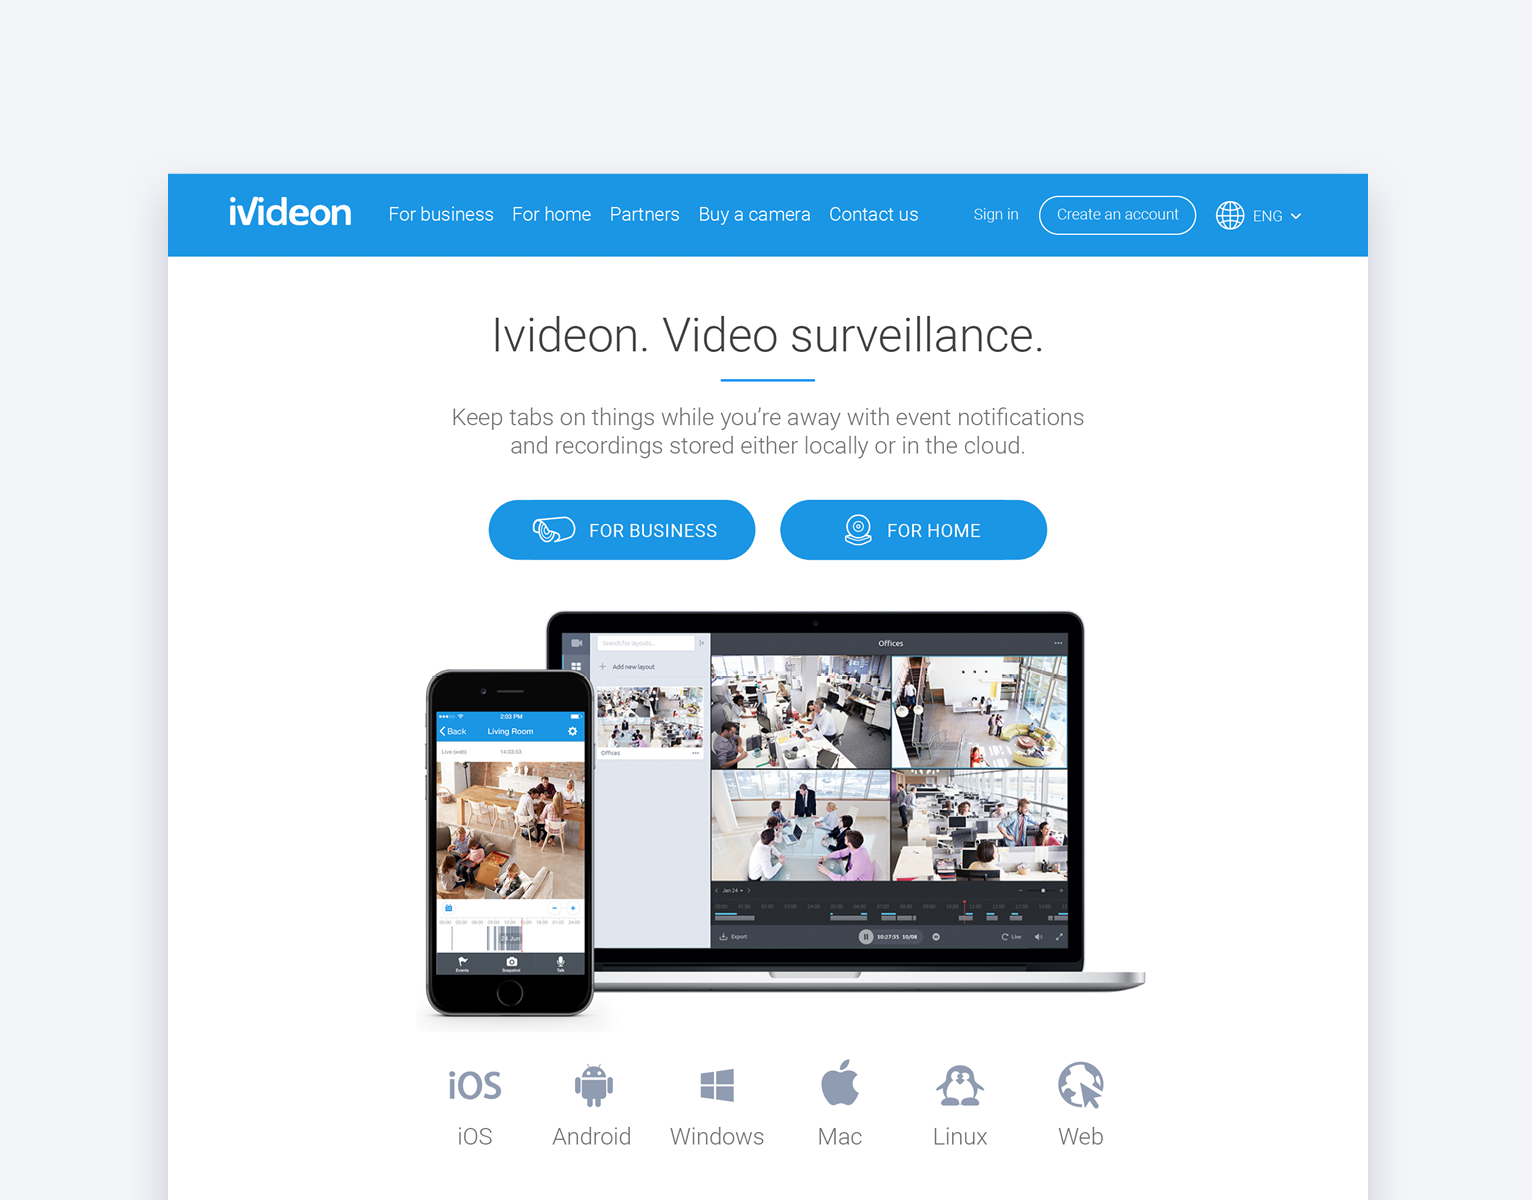
Ivideon is a global cloud video monitoring service with 3.5 million users and more than 900 business partners worldwide. Ivideon lets you connect any number of cameras in different locations to watch video from them anywhere.
Ivideon is a global cloud video monitoring service with 3.5 million users and more than 900 business partners worldwide. Ivideon lets you connect any number of cameras in different locations to watch video from them anywhere.
One of the user interfaces of the service is the Ivideon Web Dashboard that enables the customers privately and securely access and manage their connected cameras from any device that has a web browser (laptop, tablet, smartphone).
LINK
https://www.ivideon.com/my/service/login
https://www.ivideon.com/my/service/login
goals
• Make the Web Dashboard more attractive to business customers.
• Add new features such as groups of cameras for large-scale customers, visitor counting and reporting for retail, point-of-sale (cash register) integrations for retail.
• Improve structure and navigation of the Web Dashboard.
• Make the Web Dashboard more attractive to business customers.
• Add new features such as groups of cameras for large-scale customers, visitor counting and reporting for retail, point-of-sale (cash register) integrations for retail.
• Improve structure and navigation of the Web Dashboard.
challenges
• Variety of video monitoring devices (IP cameras, servers, DVRs, NVRs, webcams, etc.).
• Technical aspects of communication and configuration of different devices (device states, networking delays, settings, etc.).
• Variety of customers (from home users with 1-3 cameras to retail chains with 200-300 cameras)
• Growth of the product features, especially for business customers.
• Plan to translate into 7 more languages.
• Usage as a white-label solution by partners.
The Ivideon architecture diagram showing various connected devices
RESULTS
After Design iteration #1
• The number of existing customers switching back to the "legacy" version has decreased by 53%.
• The conversion of registered Ivideon users into active users has increased by 14% (from 5.26% to 6%).
• The conversion of registered Ivideon users into active users has increased by 14% (from 5.26% to 6%).
After Design iteration #2
• The number of existing customers actively using the "legacy" version has declined, the revenue from them stopped covering the cost of maintenance, so these users were made to upgrade, and the "legacy" version was shut down. White-label customizations started to work using the latest version of the Web Dashboard.
• The conversion of registered Ivideon users into active users has increased by 30% (from 6% to 7.8%).
• The number of business users who prefers the Web Dashboard to the Desktop App has increased: the number of logins via the Web Dashboard increased by 27% compared to the Desktop App; the total time spent watching live and archive video via the Web Dashboard increased by 16%.
Design process
Research
The company had already implemented and maintained the Web Dashboard when I joined, so I started with analysis of the existing design which was developed by the web engineers.
Research
The company had already implemented and maintained the Web Dashboard when I joined, so I started with analysis of the existing design which was developed by the web engineers.
The existing Web Dashboard had two separate versions of the UI: a "legacy" one that was used by the majority of customers and supported white-label customizations for partners, and a "modern" one that was at that time used by a small number of customers.
Ivideon Web Dashboard: the "legacy" version (left) and the "modern" version (right) prior to the redesign
Ivideon Web Dashboard "modern" version prior to the redesign,
and the Ivideon Server desktop app to connect certain types of cameras
I did competitor research, interviewed our team and some of our customers, read the user feedback in the service support channels to learn more.
At the same time, I performed the research for the website redesign project during which we decided to perform a visual refresh and to divide the users into "Home" and "Business" categories according to their personas to present the features relevant to them across the product.
Personas
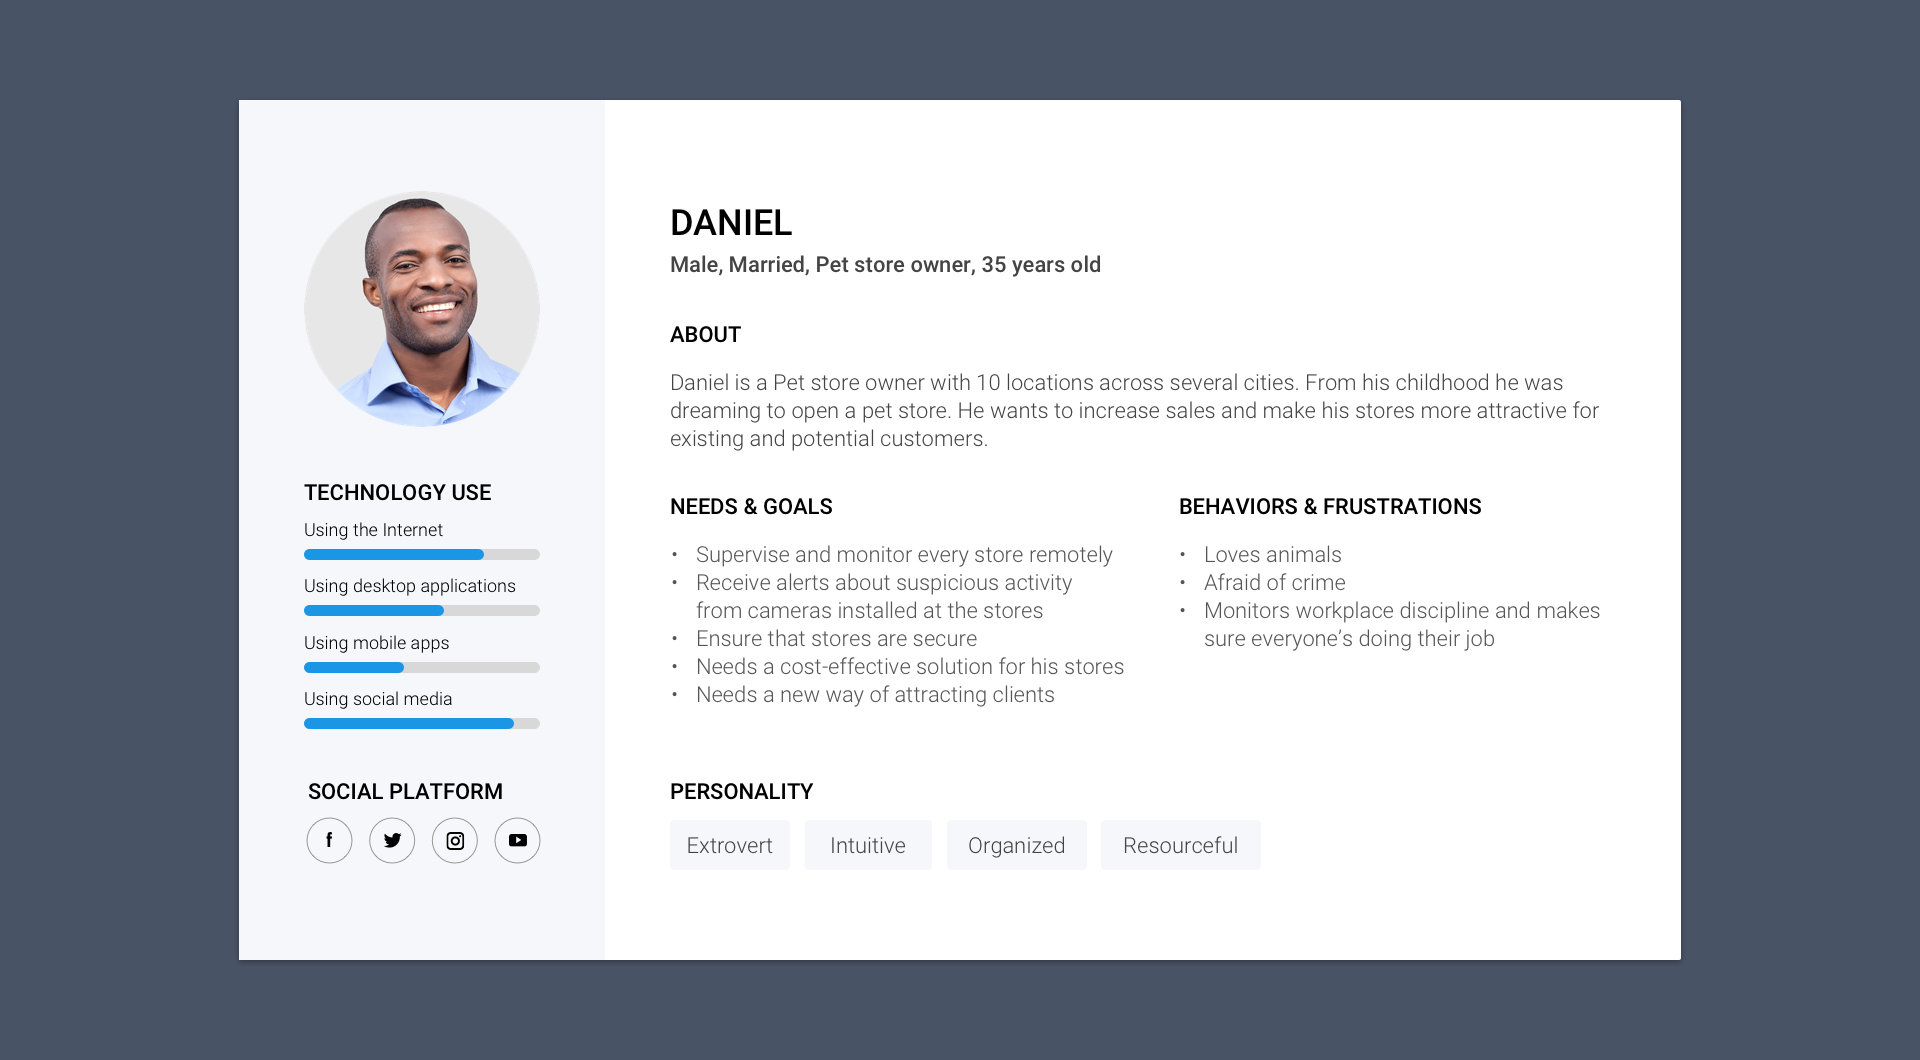
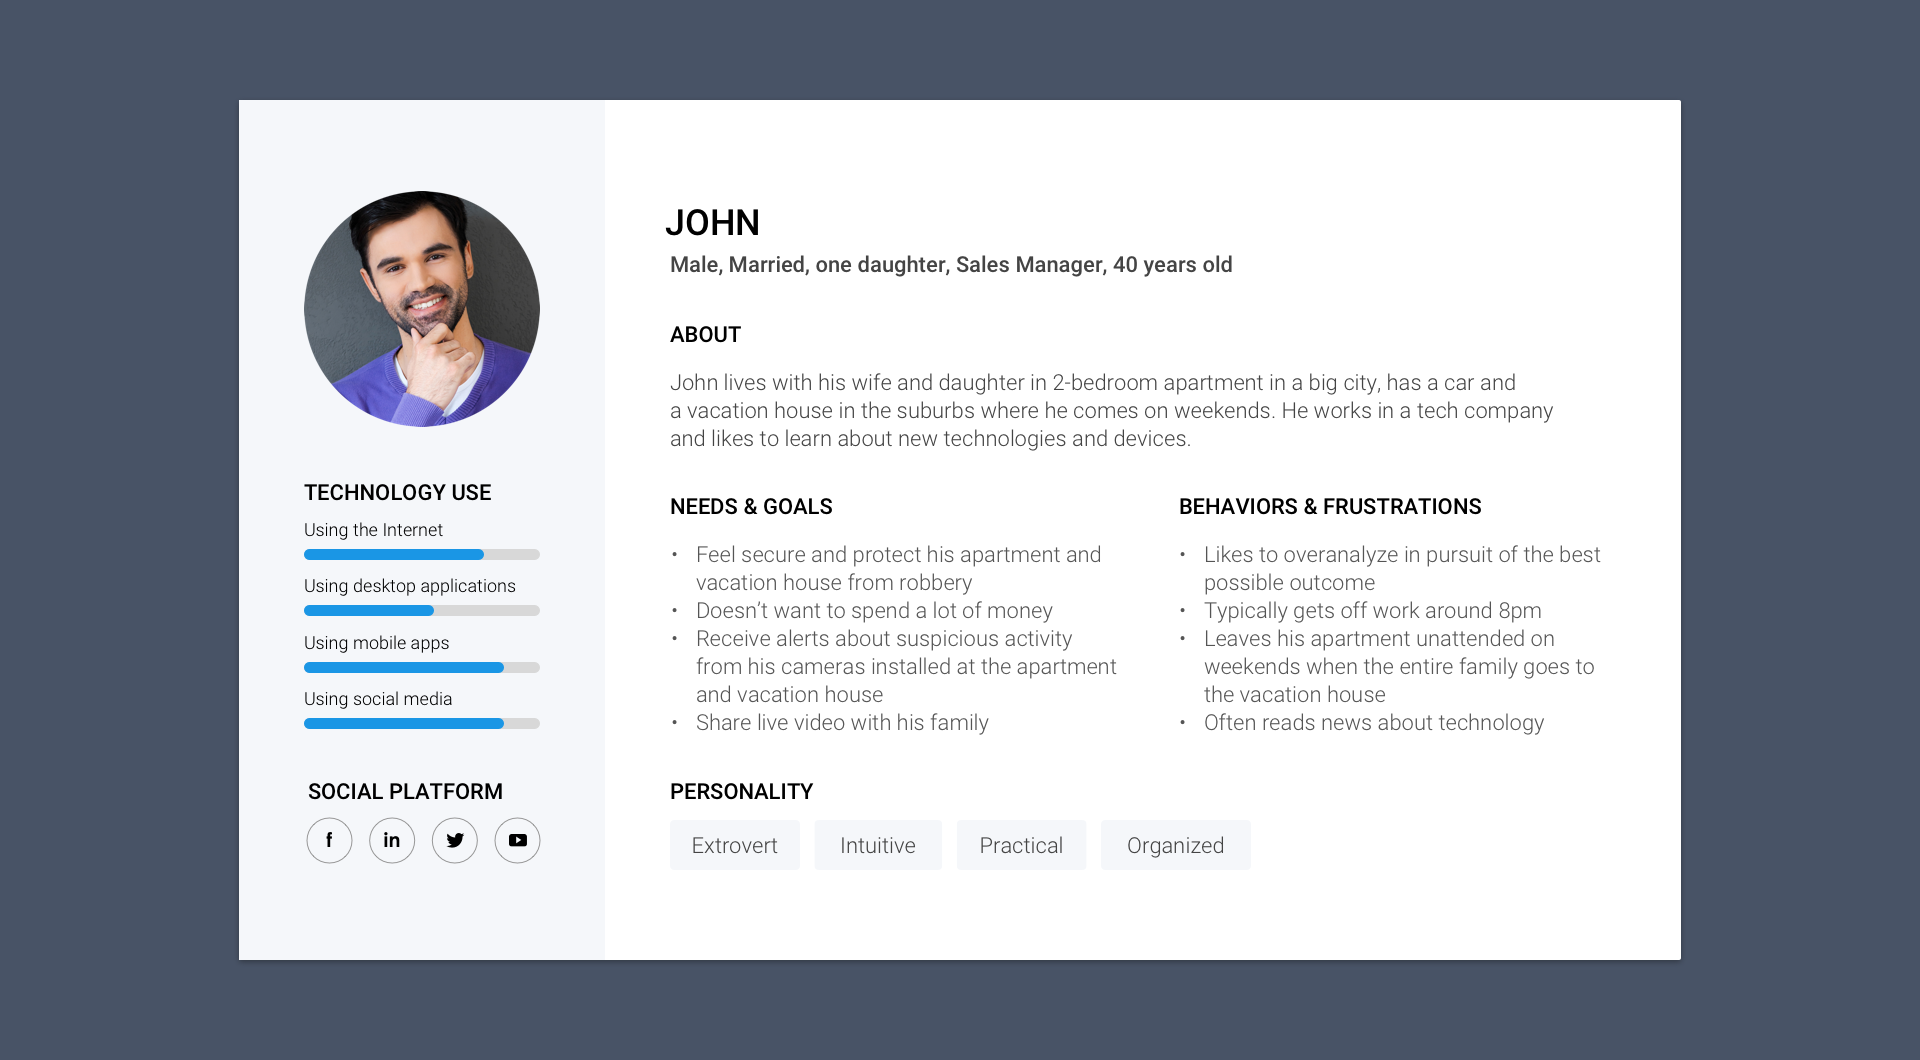
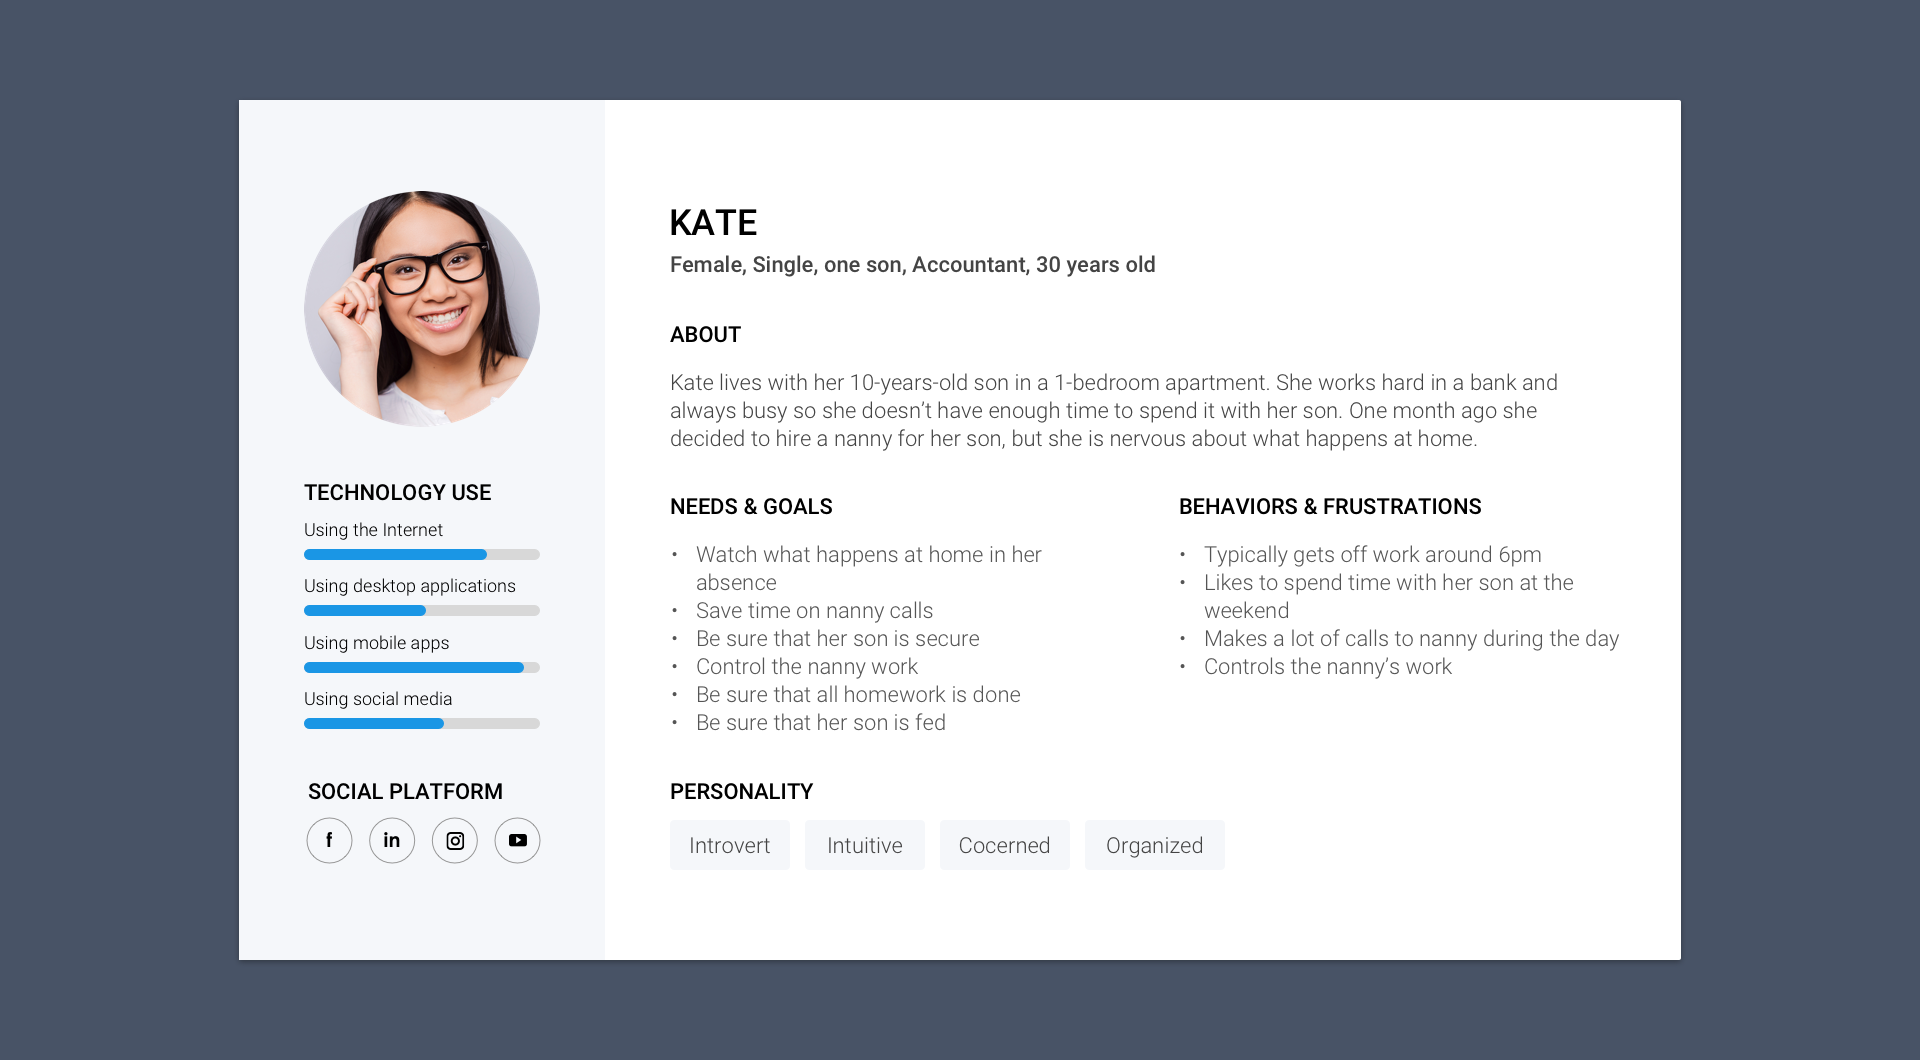
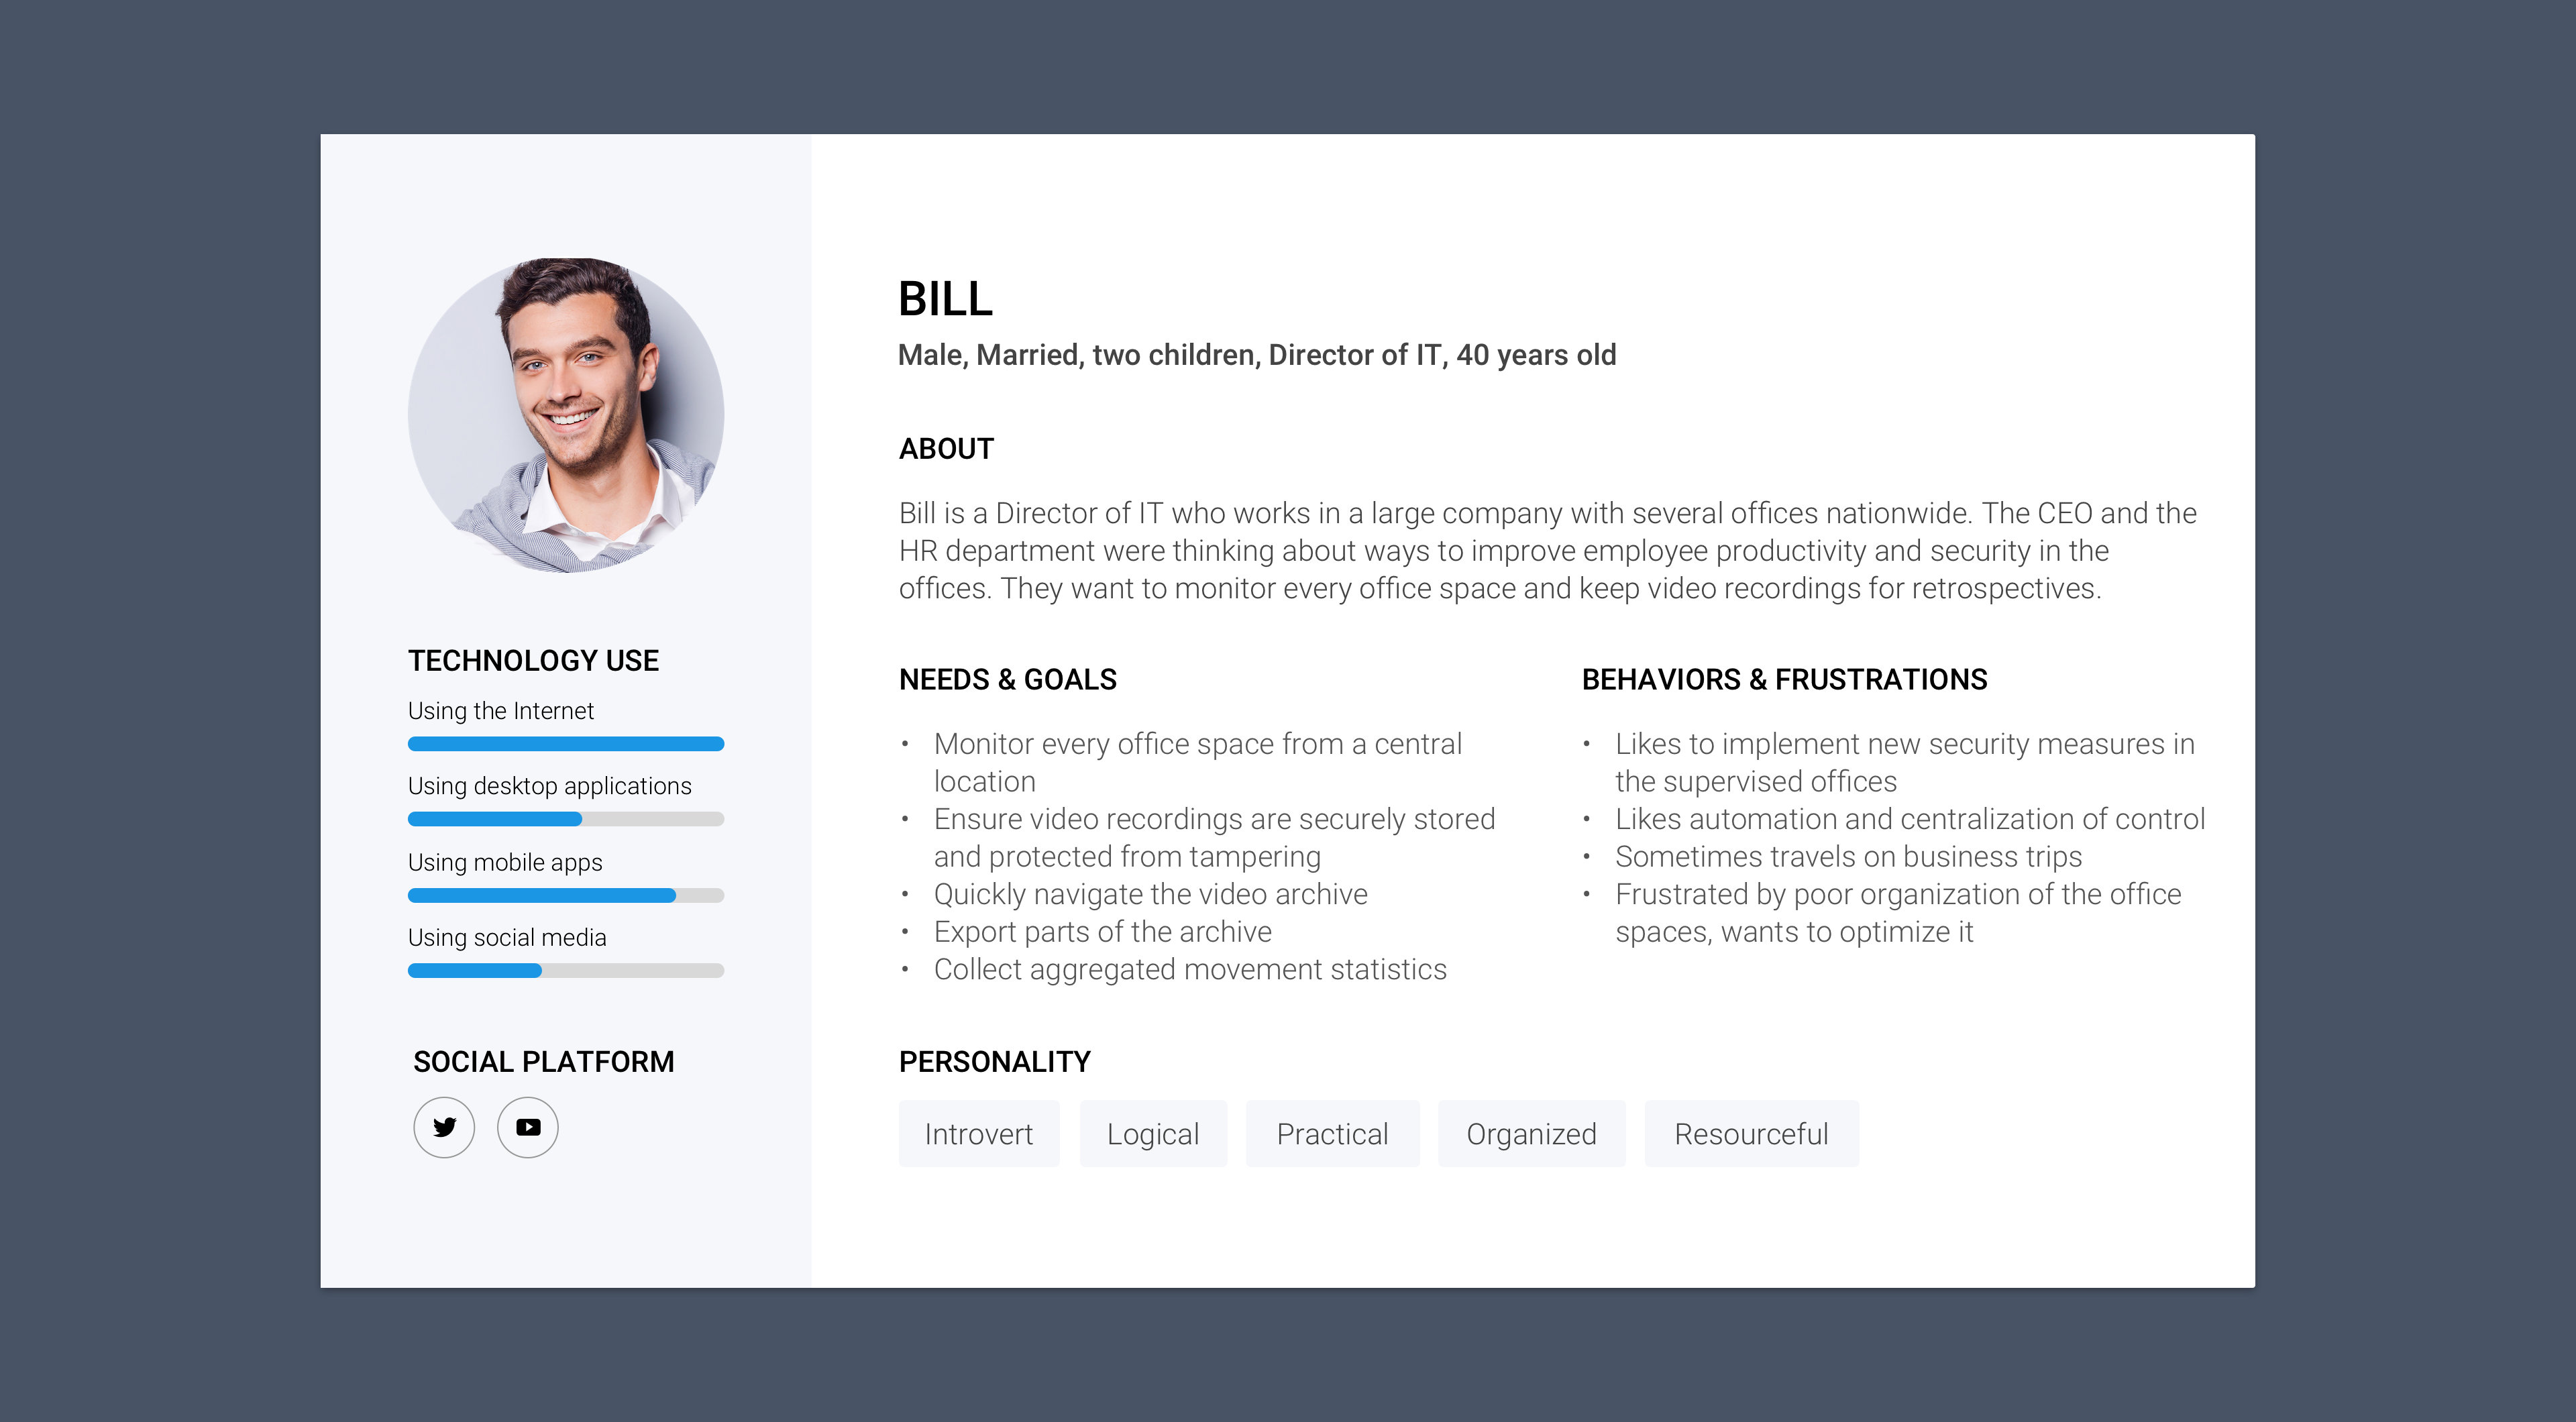
From my research, I constructed personas and explored their motivations, needs and behaviors, figured out how they would use a video monitoring web application.
From my research, I constructed personas and explored their motivations, needs and behaviors, figured out how they would use a video monitoring web application.


User journeys
Home user journey (Cristine)
Business user journey (Bill)
Main features
We gathered as a team to figure out the full list of features of the service for B2C and B2B users, including the planned ones, determined which features are relevant to each of the users, and outlined the strategy for the Web Dashboard development.
We gathered as a team to figure out the full list of features of the service for B2C and B2B users, including the planned ones, determined which features are relevant to each of the users, and outlined the strategy for the Web Dashboard development.
The following features were found relevant to both B2B and B2C:
• basic video monitoring: live feed, motion-detected on-camera and cloud video archive;
• basic camera events: motion detection, sound detection, power-off.
• basic video monitoring: live feed, motion-detected on-camera and cloud video archive;
• basic camera events: motion detection, sound detection, power-off.
The following features were found relevant to B2B only:
• advanced video monitoring: continuous video archive;
• advanced camera events: camera view obstruction, face recognition;
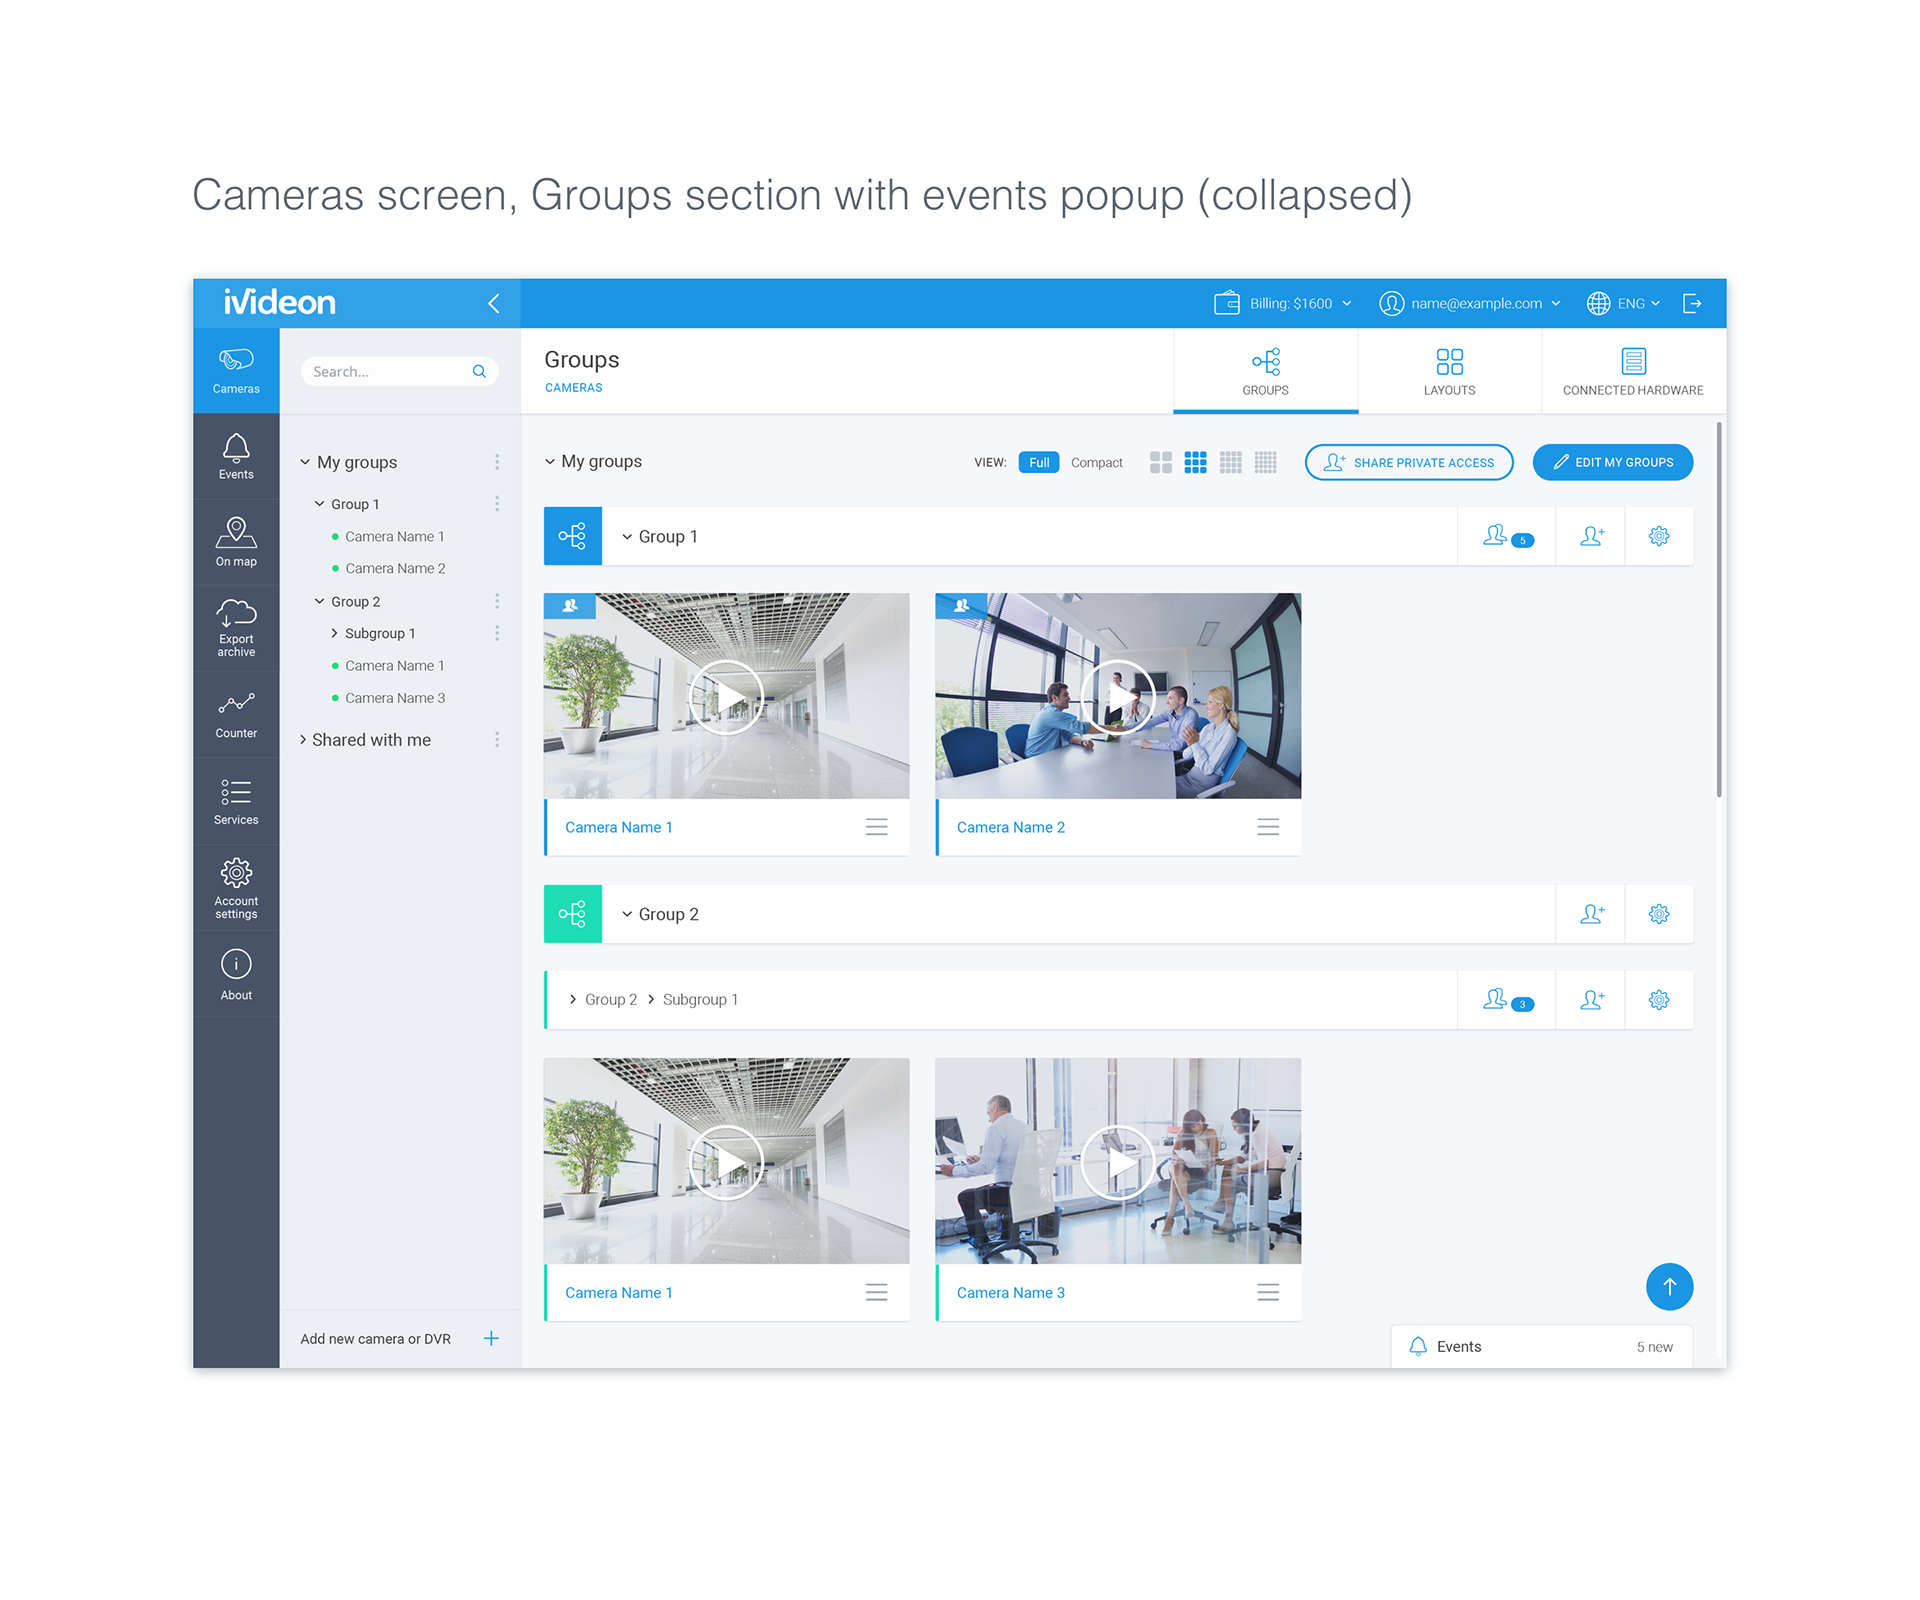
• groups of cameras;
• map of cameras;
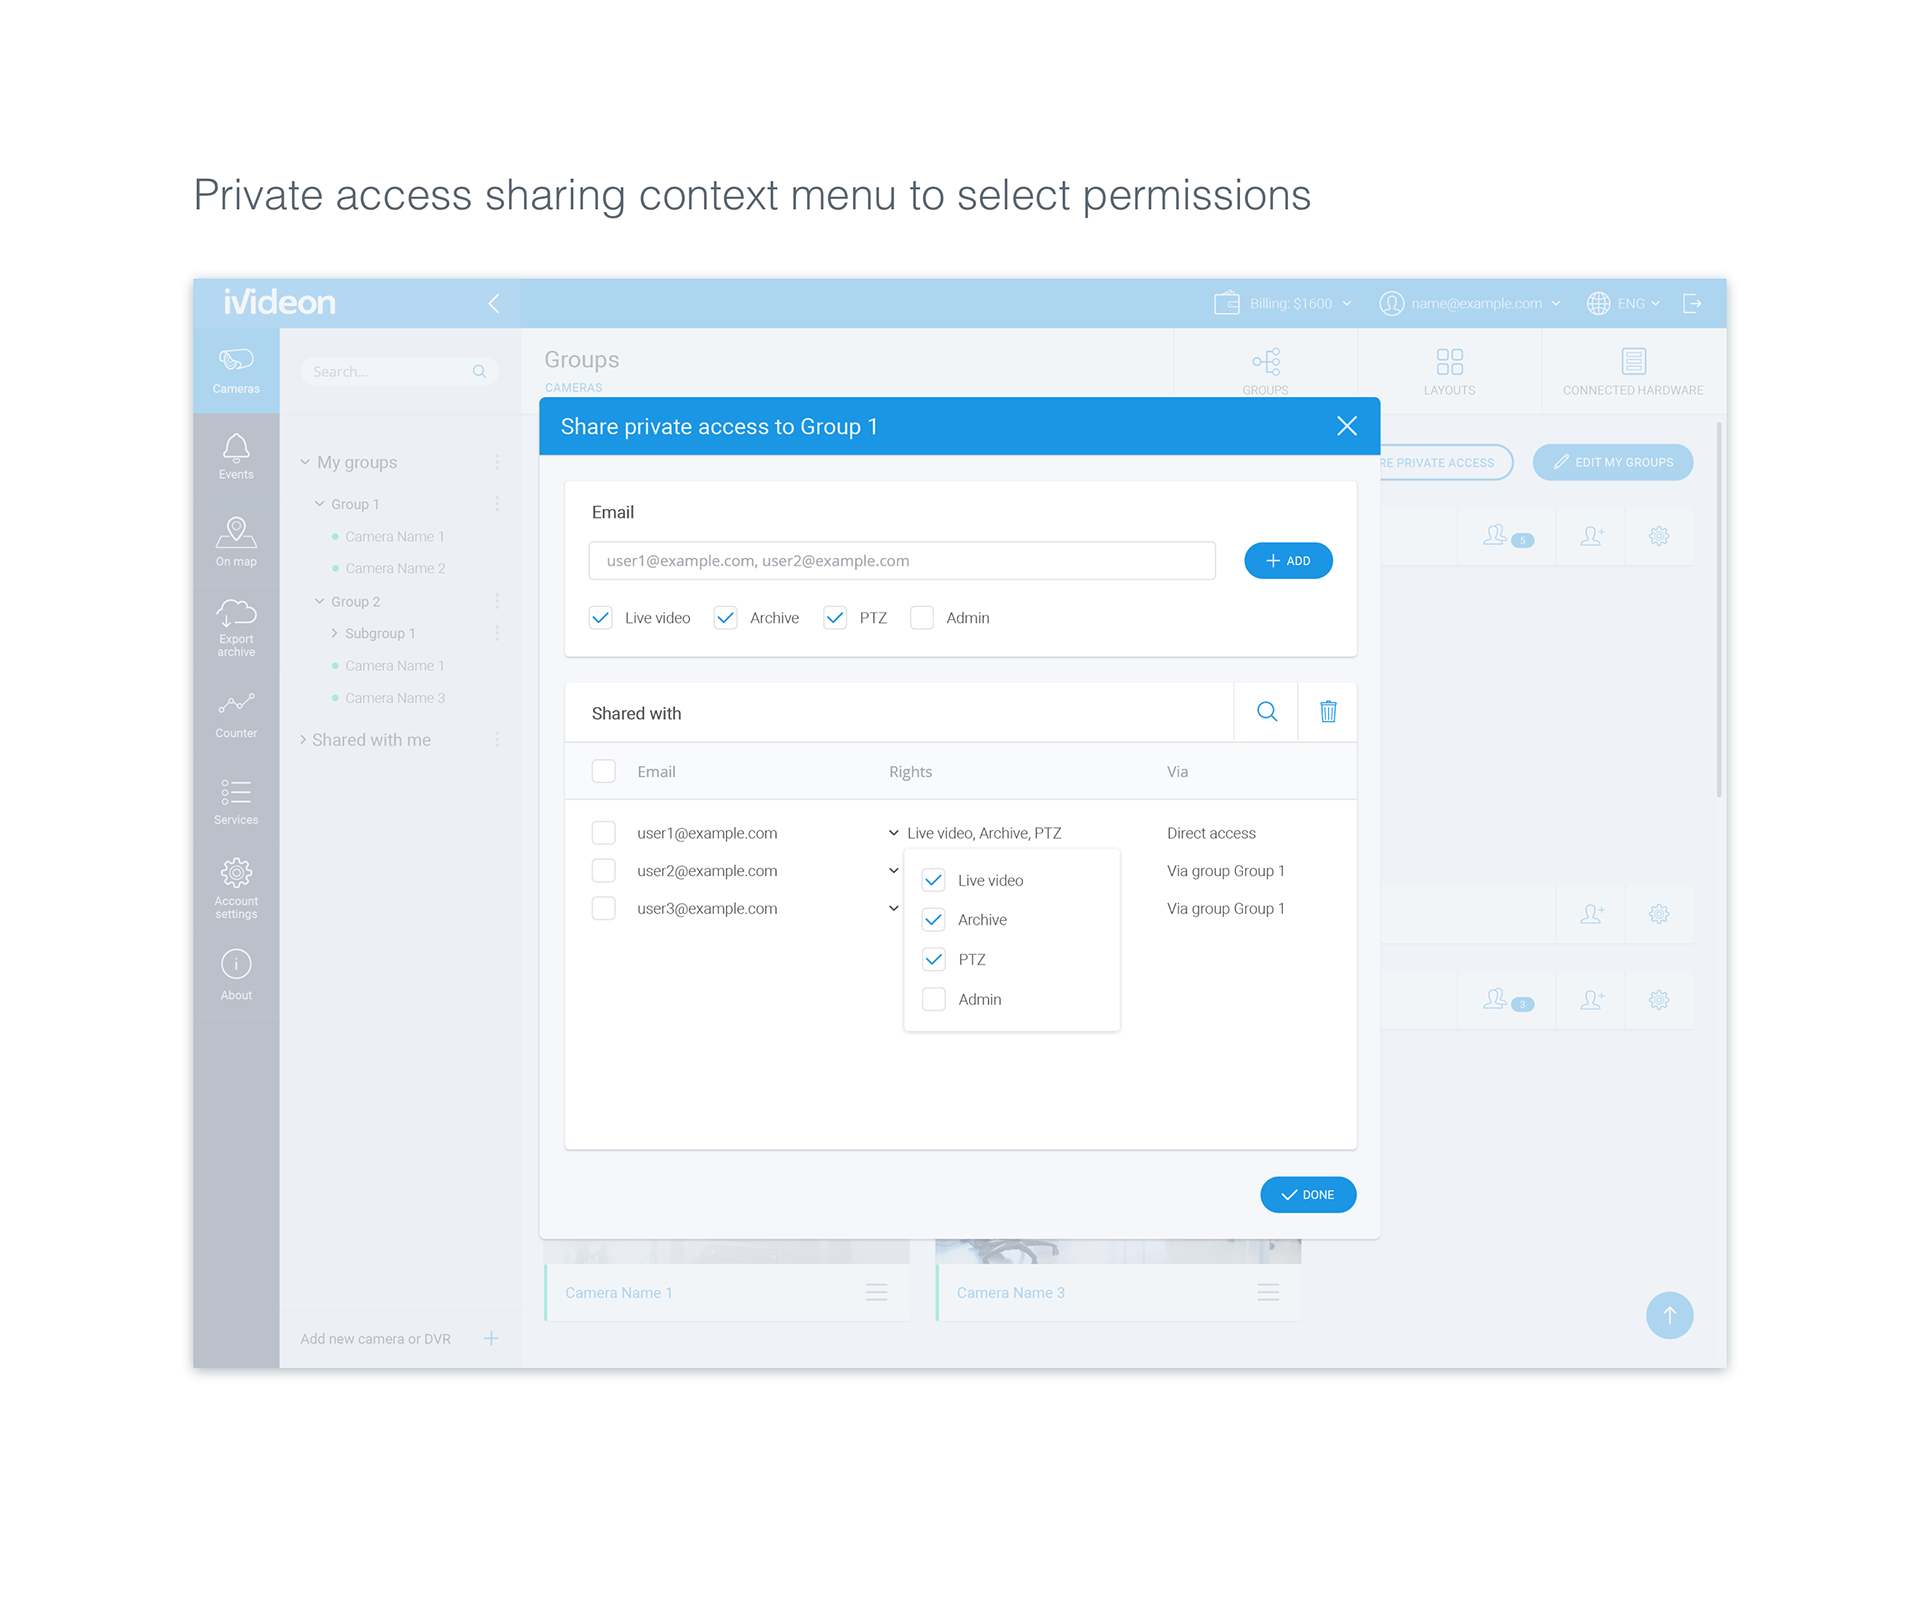
• large-scale private access sharing (organization);
• unlimited public video broadcasting;
• motion detection configuration (sensitivity, masking);
• visitor counting and reporting;
• point-of-sale (cash register) integrations for retail;
• customer movement heatmap for retail;
• queue monitoring for retail;
The following features were found relevant to B2C only:
• small-scale private access sharing (family);
• limited public video broadcasting;
• video event clip sharing to social networks.
• small-scale private access sharing (family);
• limited public video broadcasting;
• video event clip sharing to social networks.
Design iteration #1
Problem #1: The Web Dashboard design was inconsistent with the design of the Website
Solution: Update the design of the Web Dashboard using the new style of the Website
Problem #2: Two versions of the Web Dashboard, both actively used
The "legacy" version was lighter and was used by all the white-label partners, but the "modern" version had improved UI structure, several advanced features, and was planned to grow even more.
The "legacy" version was lighter and was used by all the white-label partners, but the "modern" version had improved UI structure, several advanced features, and was planned to grow even more.
Solution: Gradually upgrade Ivideon customers to use the "modern" version
The team decided to focus design and engineering efforts on the "modern" version and eventually shut down the "legacy" one. We planned to add support for the white-label customization to the "modern" version, so my designs were made with that in mind: with a constrained color palette and minimalistic UI elements.
We switched all new Ivideon signups to use the "modern" version. We added an upgrade suggestion to the "legacy" version for the existing customers, and kept an option to switch back.
We measured the number of switches between versions to understand our existing customers' upgrade behavior. With the style refresh, the number of existing customers who tried the "modern" version and did not switch back has decreased by 53%.
I worked closely with engineers to prepare the customers for the planned bigger changes and to release several reskin iterations of the "modern" version over the timespan of the redesign project to evaluate their interest in the upgrade.
I worked closely with engineers to prepare the customers for the planned bigger changes and to release several reskin iterations of the "modern" version over the timespan of the redesign project to evaluate their interest in the upgrade.
Before and after the Design iteration #1
Ivideon Web Dashboard before (left) and after a reskin iteration (right)
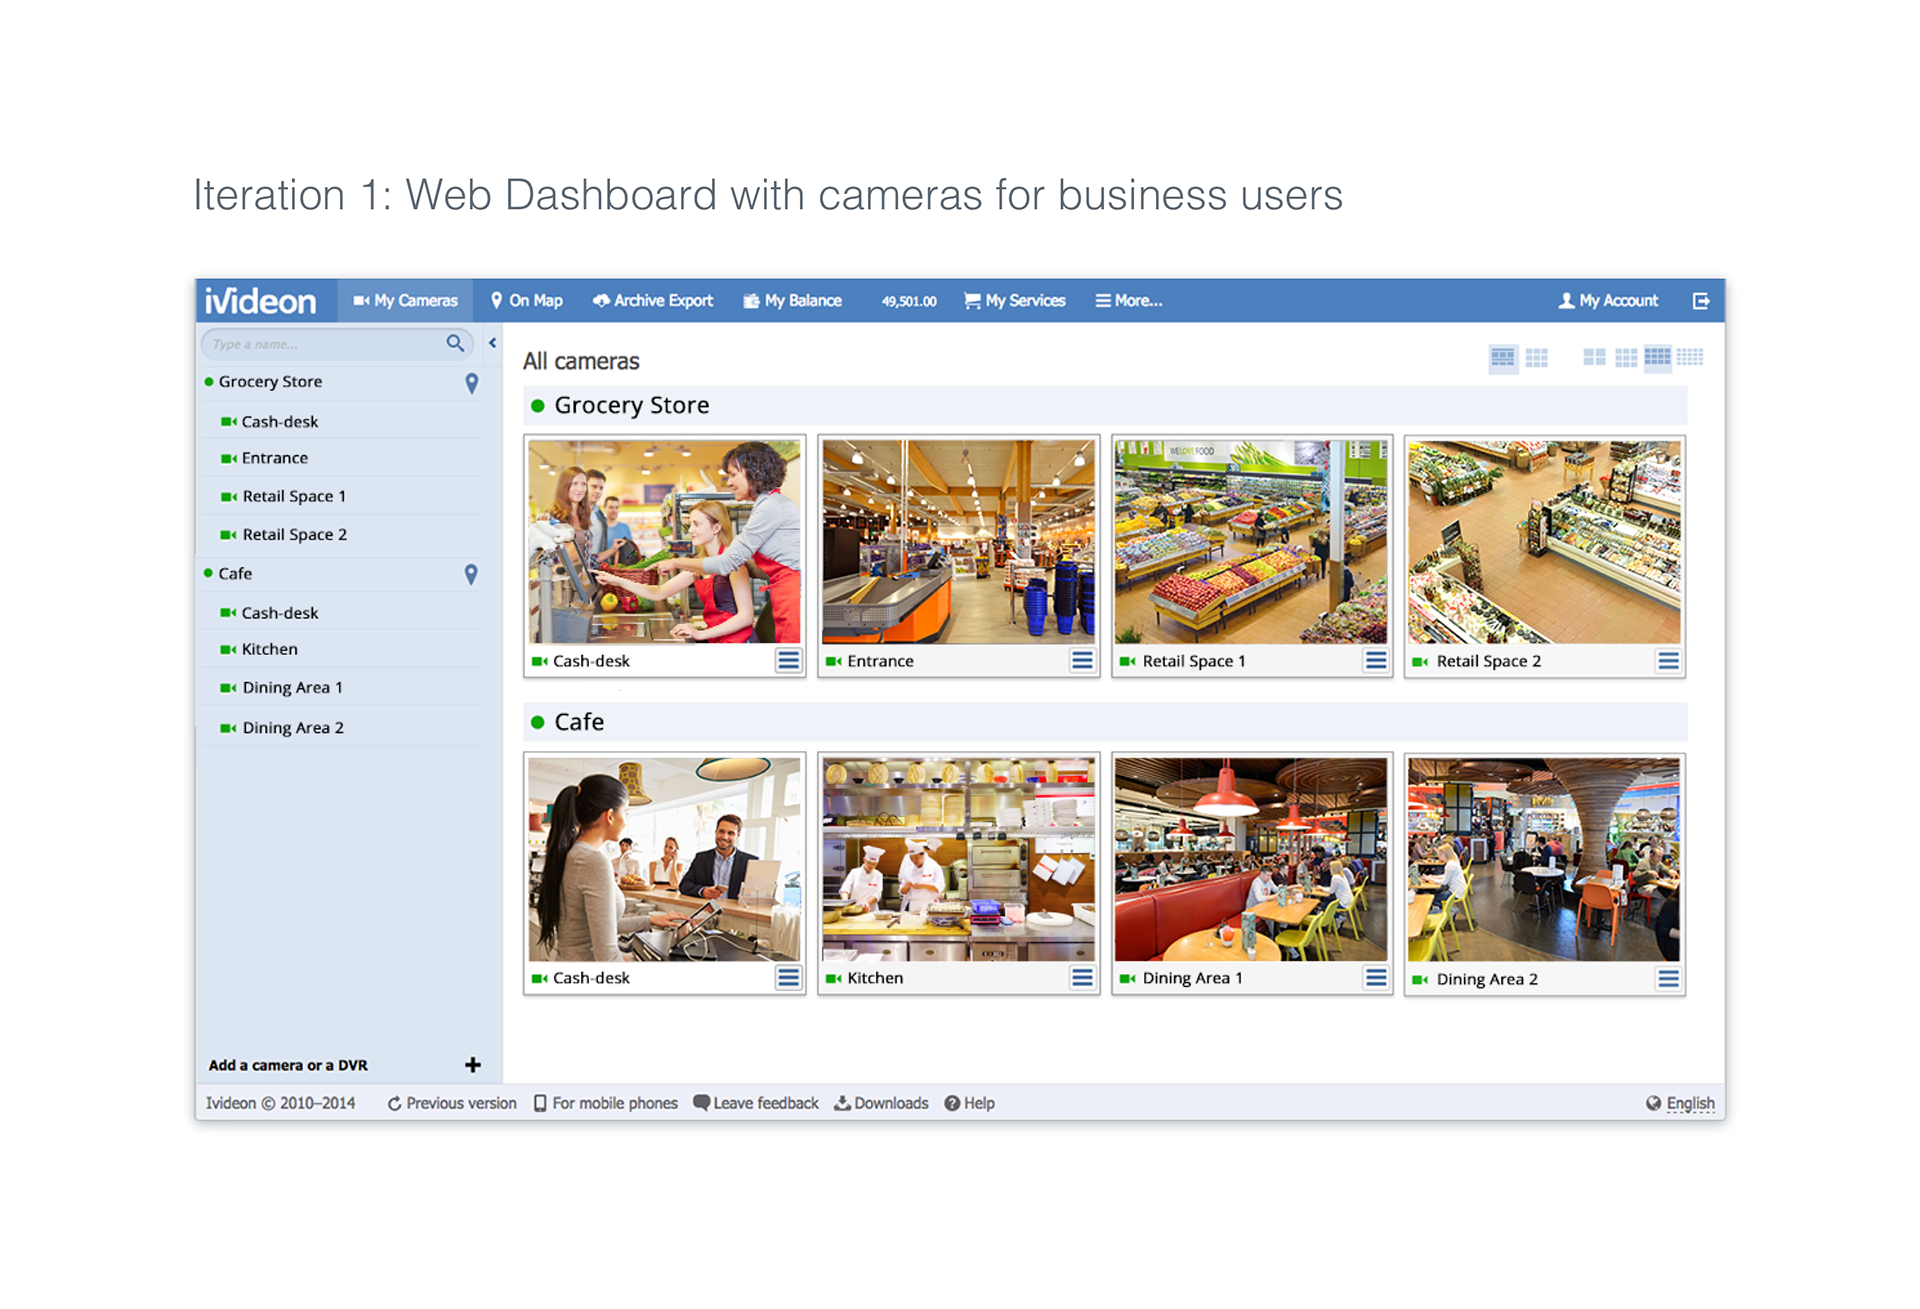

While reviewing the UIs with the team I discovered a few opportunities for UX improvements to the existing Web Dashboard which we were going to tackle in the Design Iteration #2.
Design iteration #2
Problem #1: the menu structure was too condensed and not scalable enough
The UI needed to accommodate several new features we planned to roll out in the upcoming years. The existing layout of the "modern" version of Ivideon Web Dashboard was structured as a split-screen with a horizontal navigation bar at the top, a sidebar on the left, and a content area on the right. The horizontal navigation bar could not fit in all the features due to limited screen space, had a dropdown menu "More..." which hid a few important features such as visitors counter.
Solution: split the navigation into vertical and horizontal
I decided to split the navigation into two areas: the monitoring features in the vertical navigation bar on the left, and the user account features in the horizontal navigation bar at the top, with the logo in the left-top corner. This approach structures the UI so that the level of detail increases from left to right and from top to bottom, and it kept the familiar content structure of the existing layout.Ivideon Web Dashboard navigation layout change: before (left) and after (right)
Problem #2: growth of advanced features for business that aren't useful for home users
Camera groups are useful if the account has more than 20 cameras. Visitor counters, queue monitoring, and heatmaps are useful for shop owners and larger retail stores. Point-of-sale integrations is clearly a business feature for restaurants and retail.
Solution: do not show business-oriented features to home customers
As we've made the users select the account type (business or home) at signup, we got the data to filter the features and adapt the UI for particular users.We planned to add more adaptation based on the account type in the next improvement iterations, after all the big features have been released.
Problem #3: the look & feel was not polished enough
By comparing visually with the successful competitors' products I figured out that the style did not align with the goal of the company to present a modern worldwide cloud service that the team had built.
Solution: develop a design system that matches the refreshed brand style
I combined and unified the common parts of the UI design work for the Website and the Web Dashboard to produce a consistent look & feel.
Across Ivideon web interfaces, I changed the typeface to Roboto:
• Roboto has a readable shape, in which the whitespace takes the lead to create a sharp design.
• The elegant contrast of its strokes makes the body text easy to read.
• Being a comprehensive family font makes it a great choice for web design.
• Roboto has a readable shape, in which the whitespace takes the lead to create a sharp design.
• The elegant contrast of its strokes makes the body text easy to read.
• Being a comprehensive family font makes it a great choice for web design.
I changed the Ivideon brand color from dark greyish blue to sky blue to make it more appealing and memorable, inverted the logo.
I reduced the number of colors used across the UIs, increased contrast, added more whitespace to the layouts and UI components.
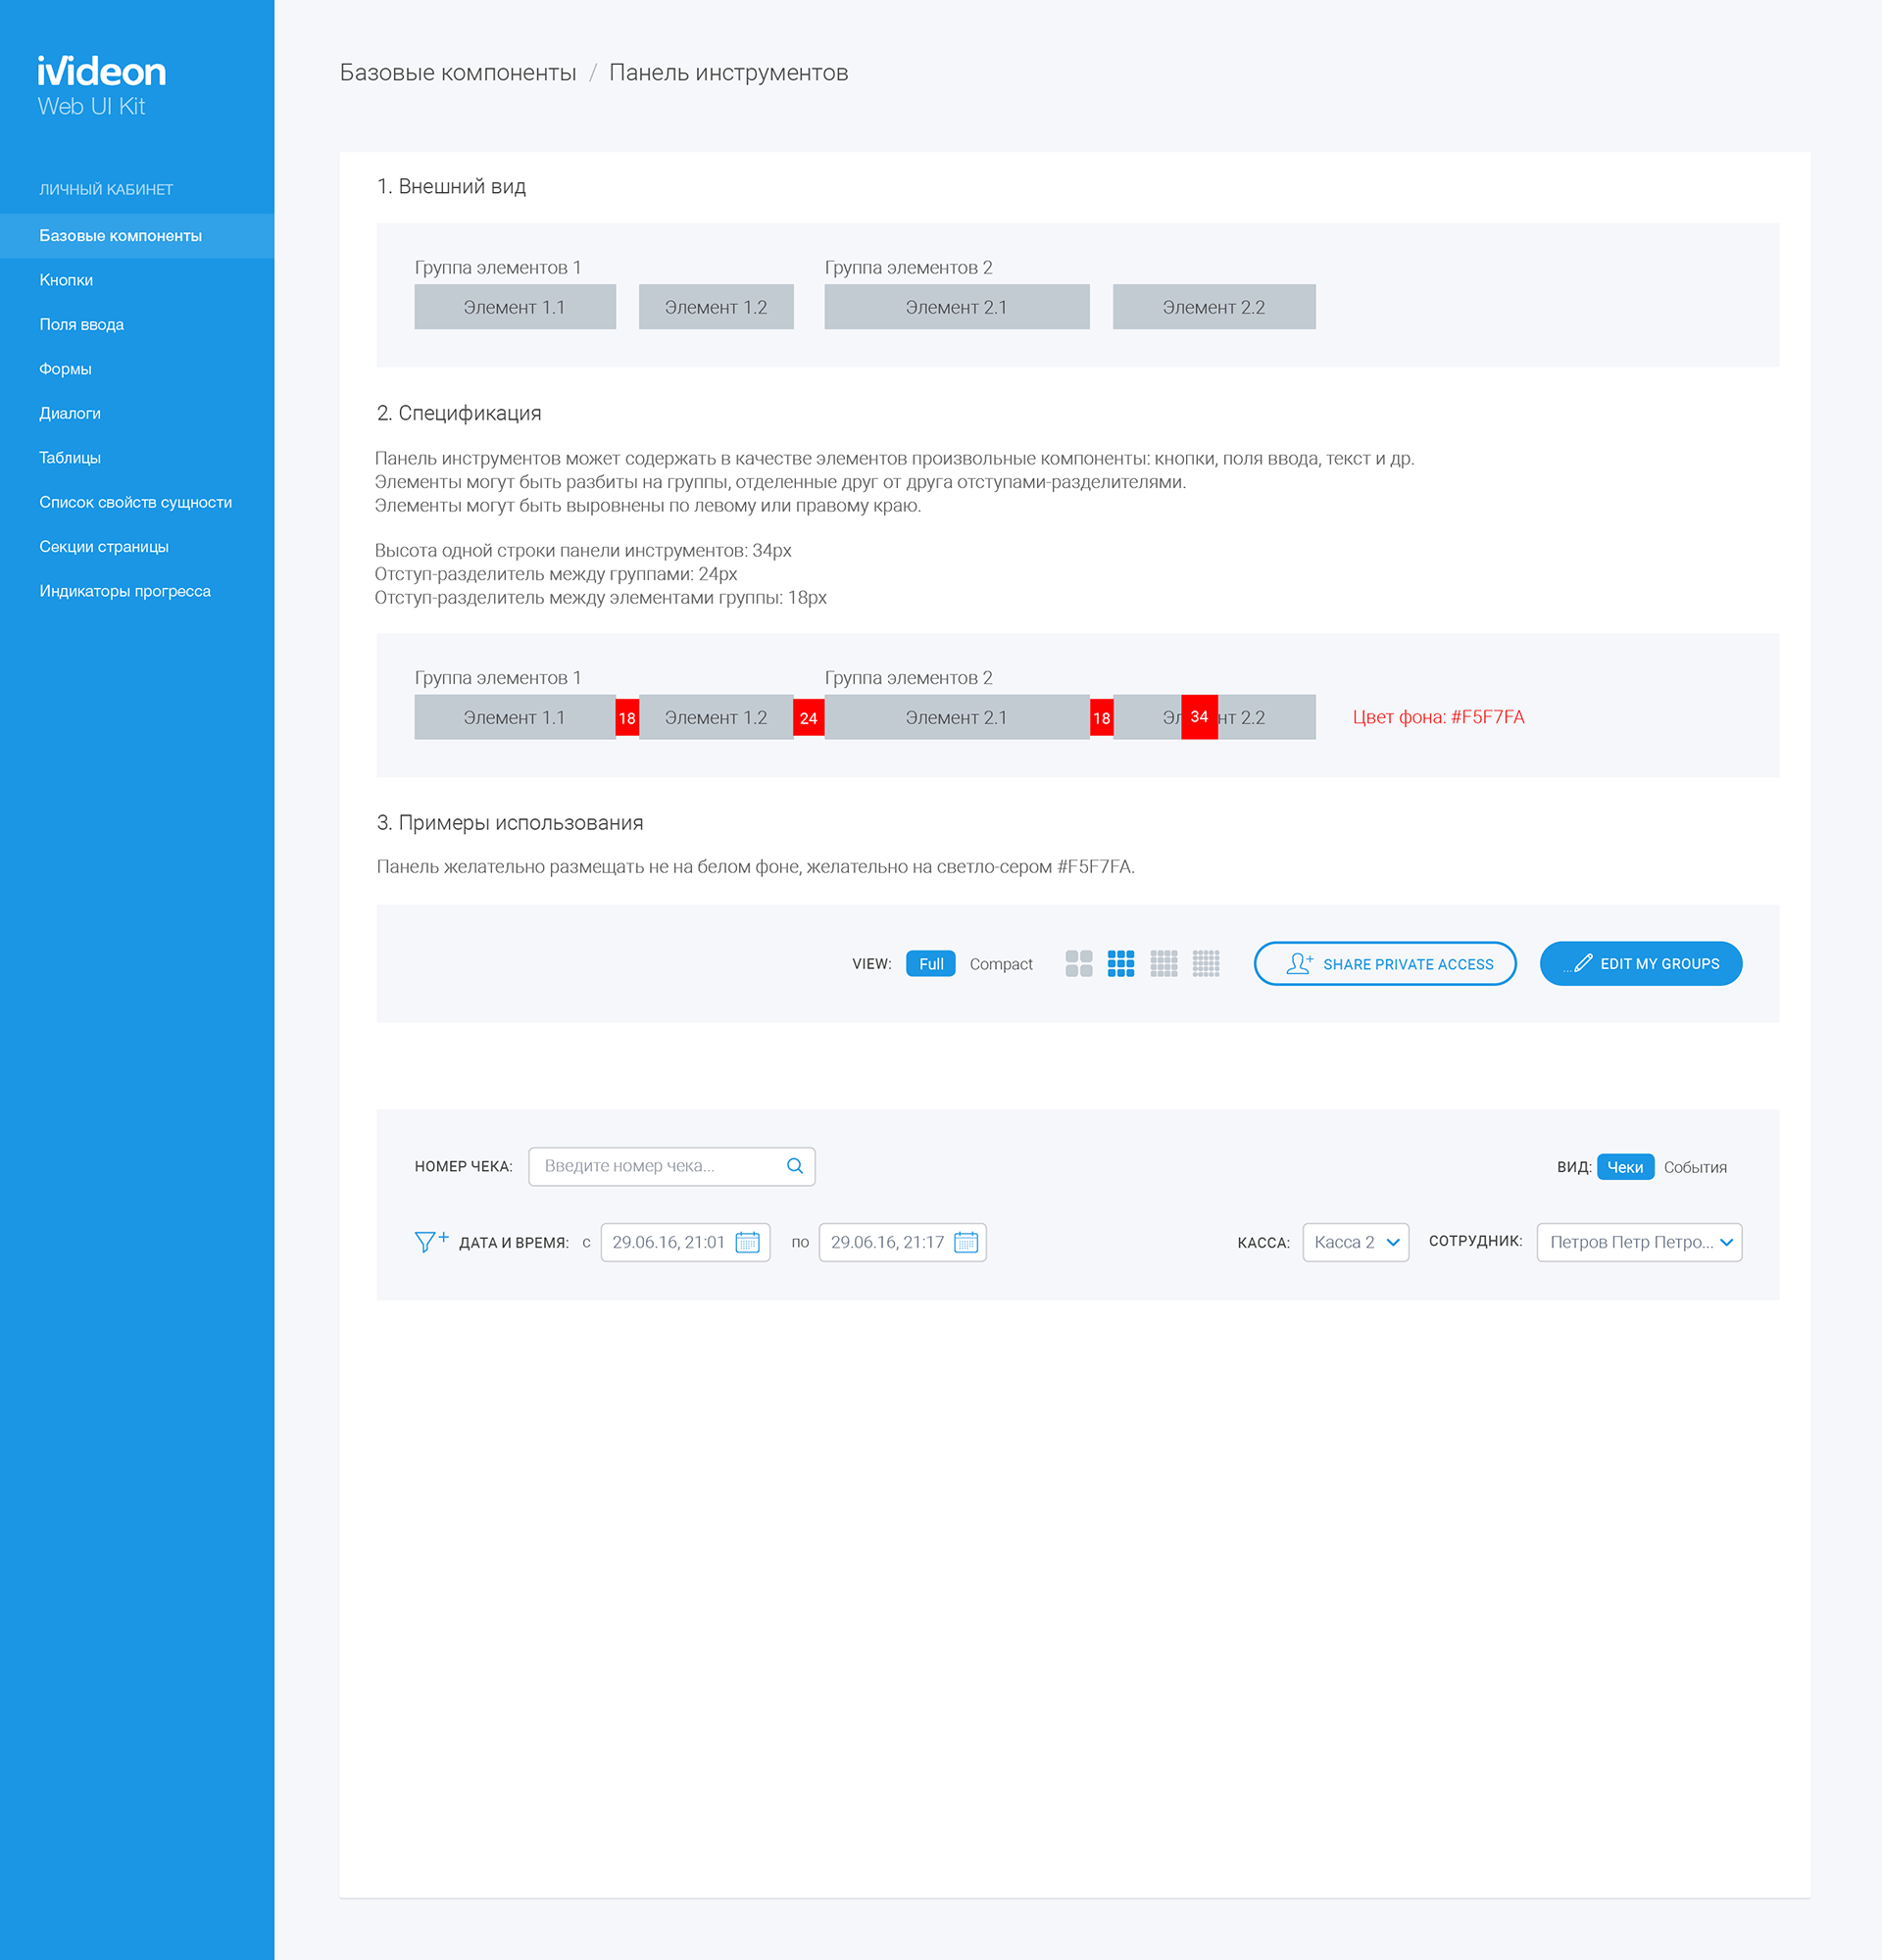
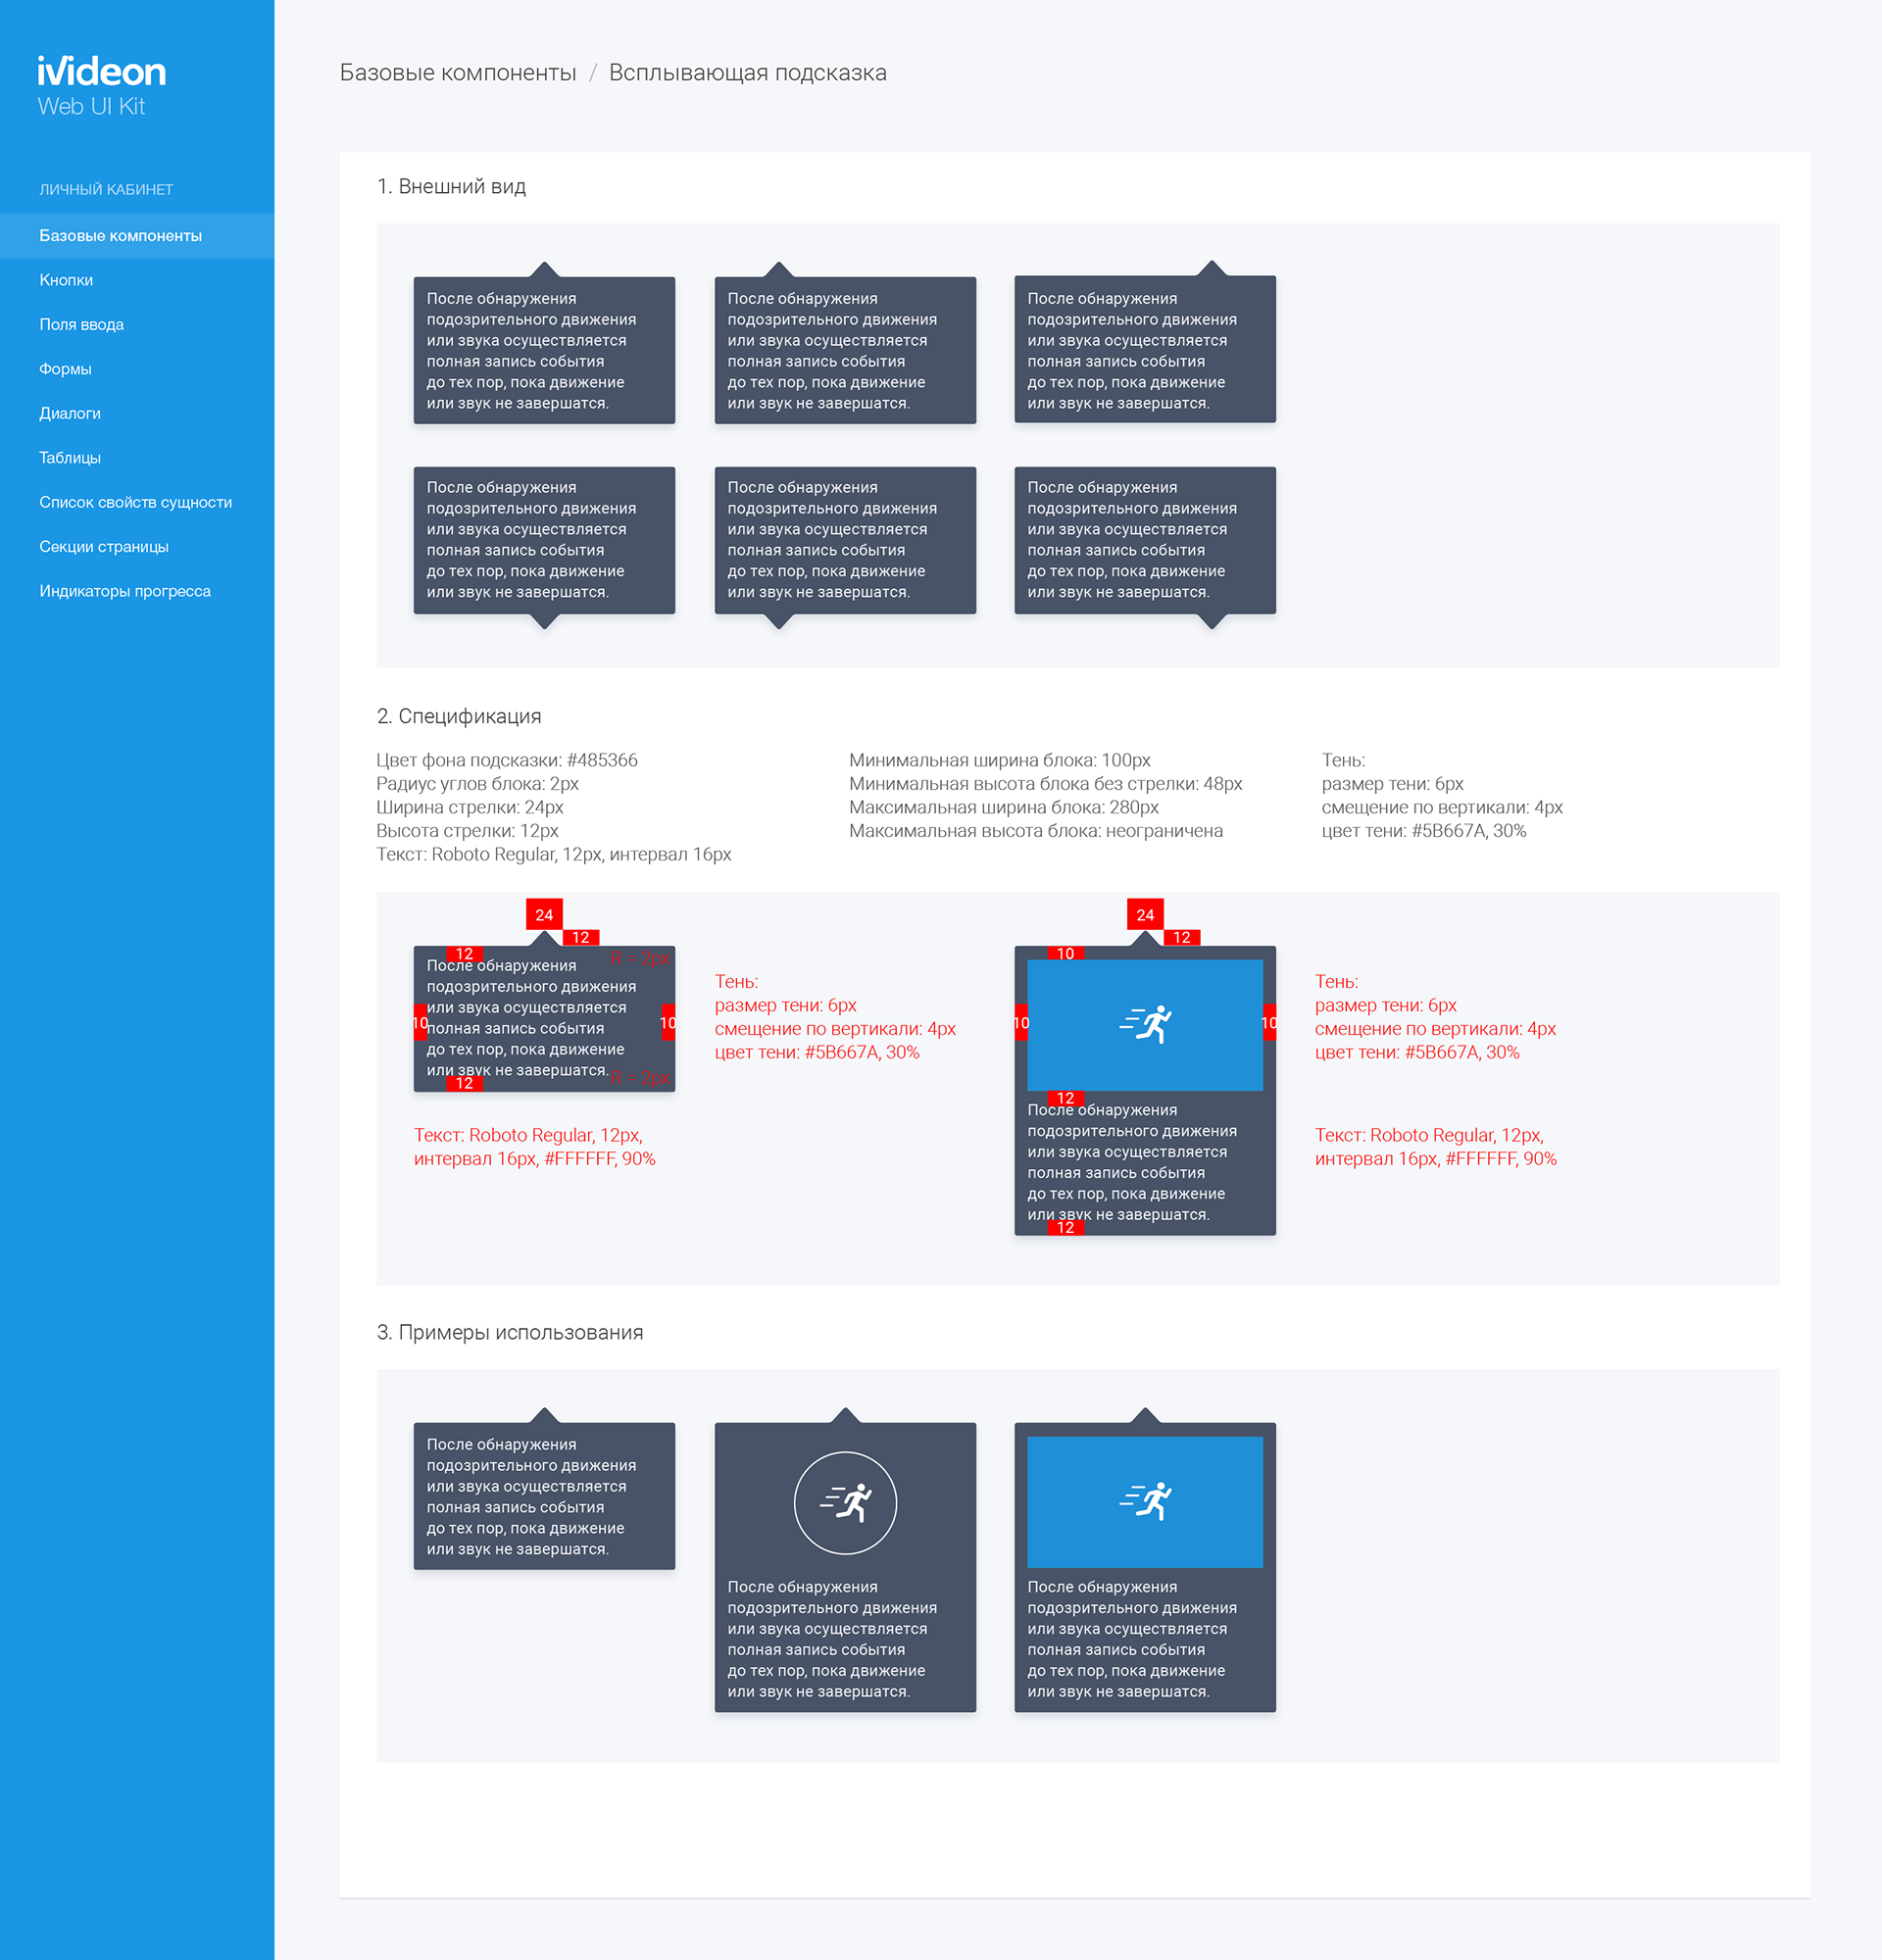
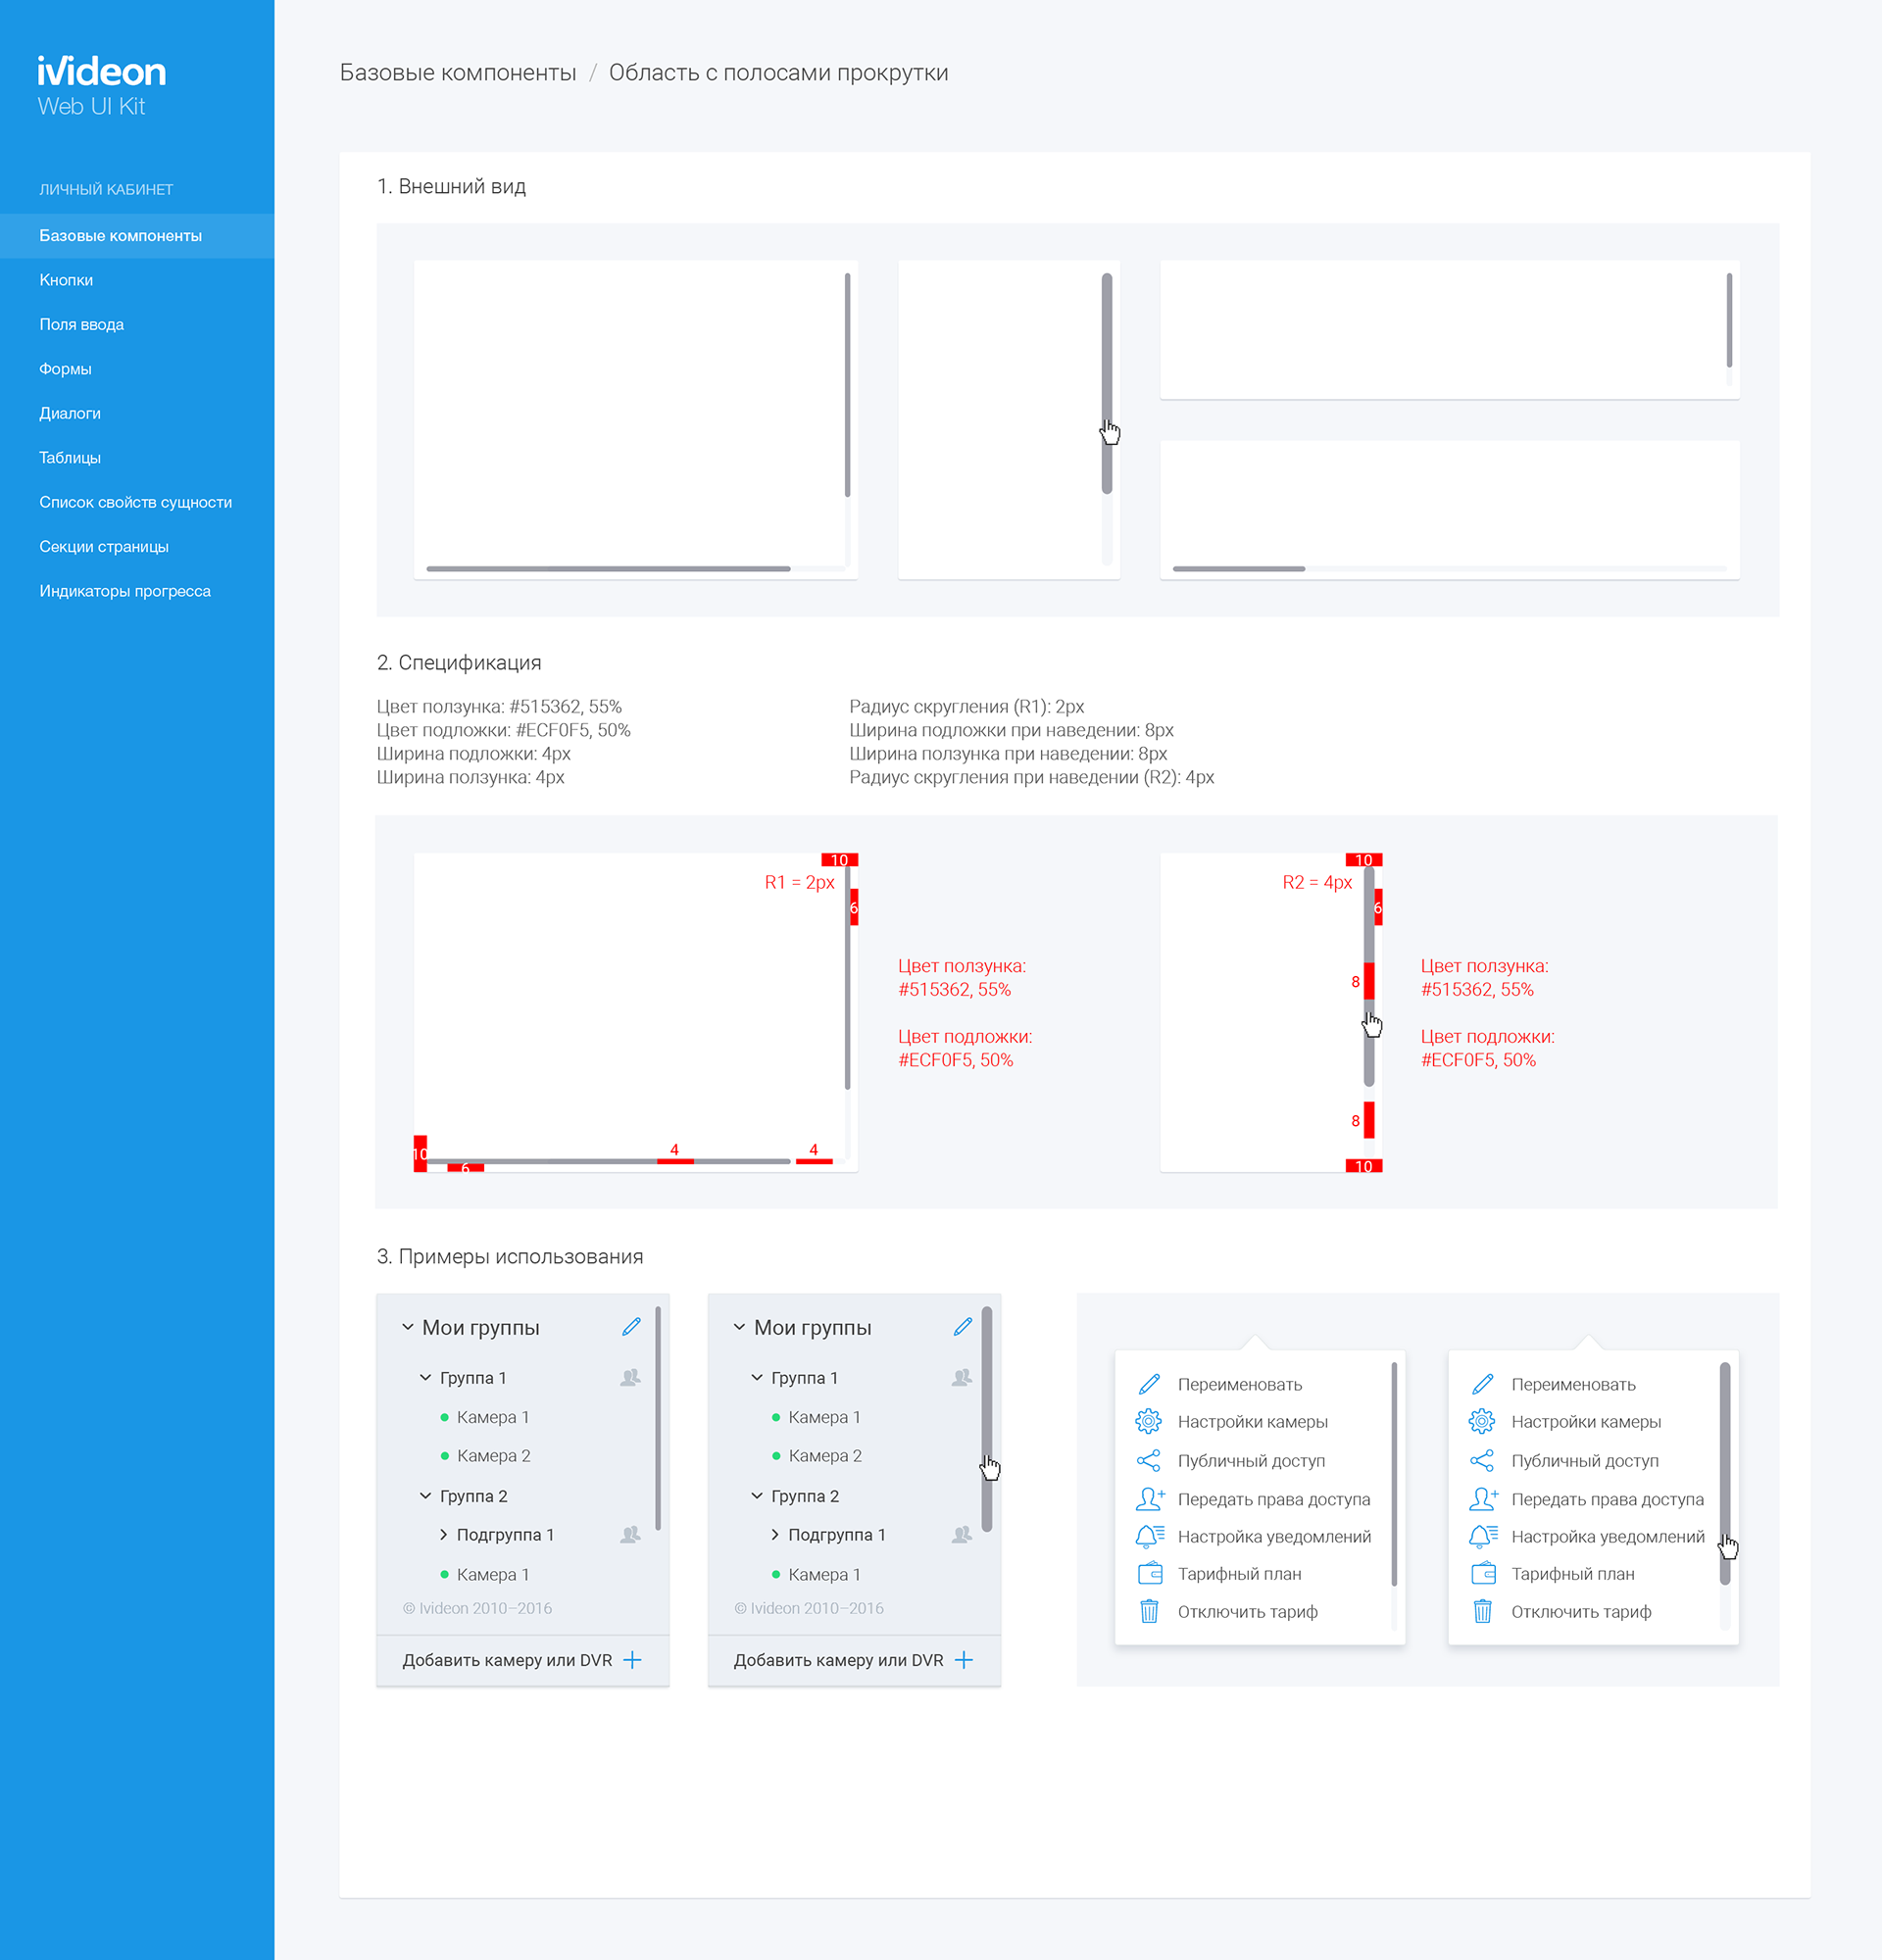
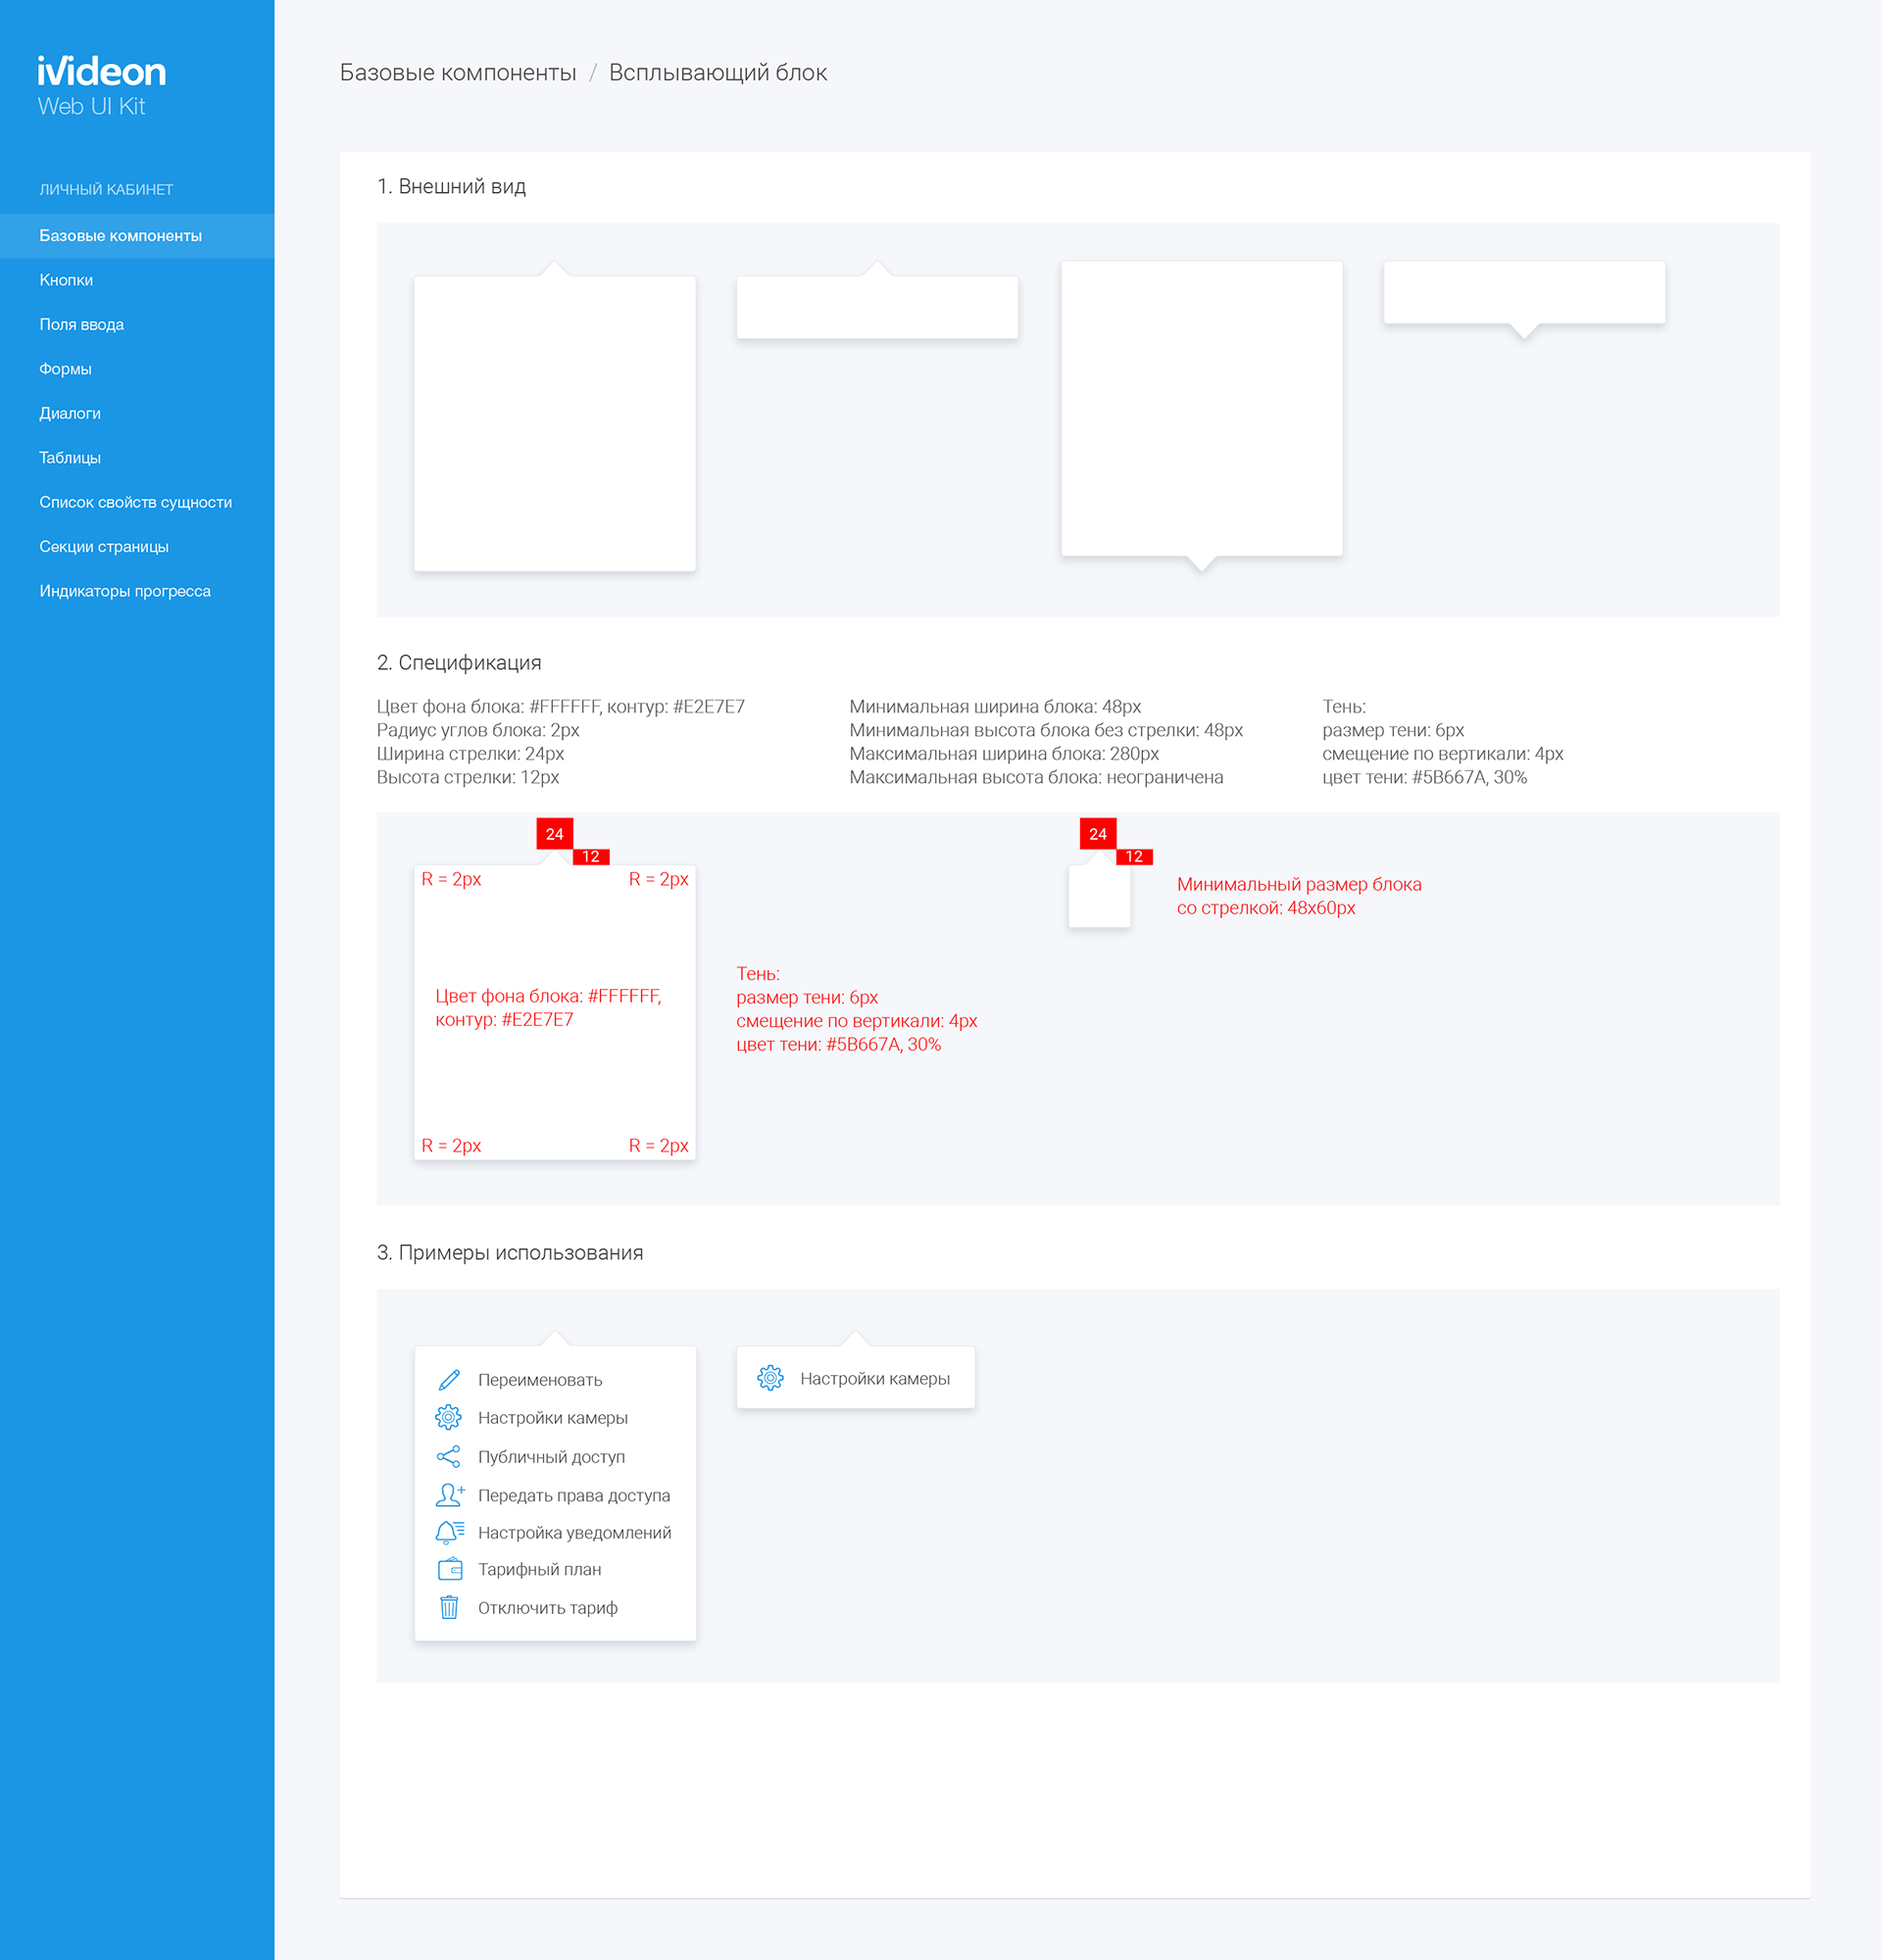
For the Web Dashboard UI, I developed:
• a color palette,
• a UI component system,
• and an extensive icon set
for the engineers and designers to use as a reference.
• a color palette,
• a UI component system,
• and an extensive icon set
for the engineers and designers to use as a reference.



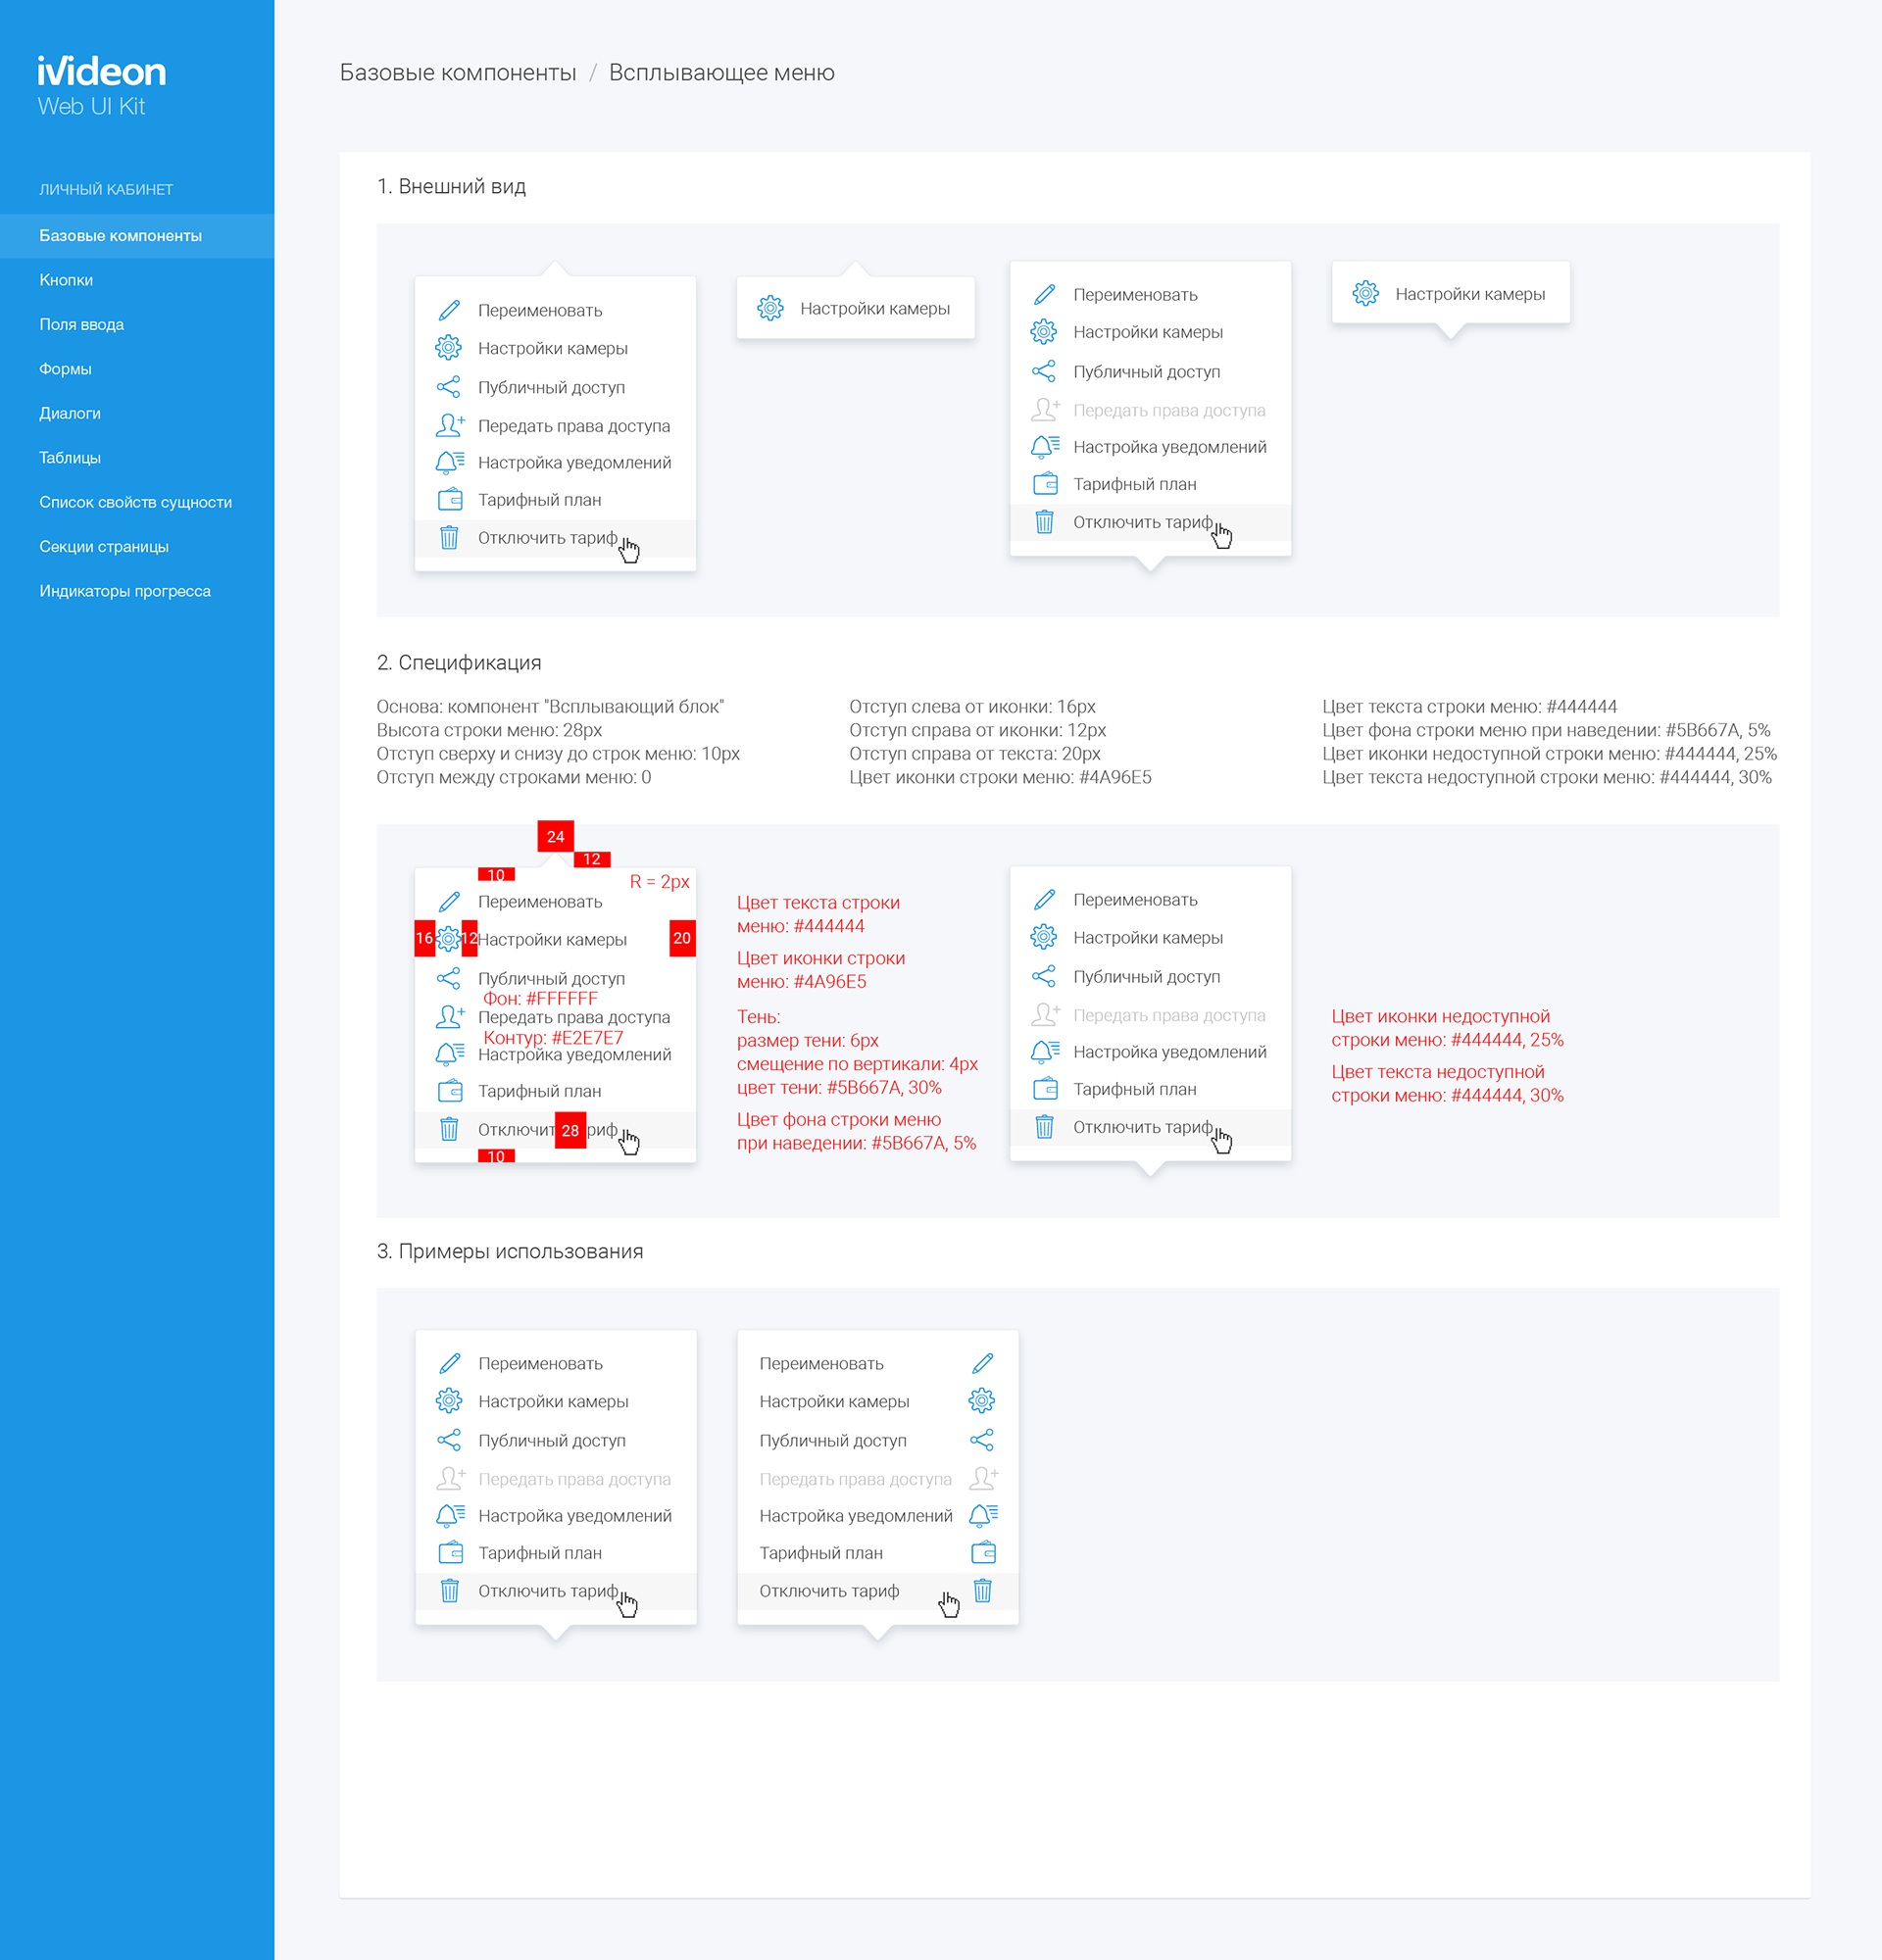
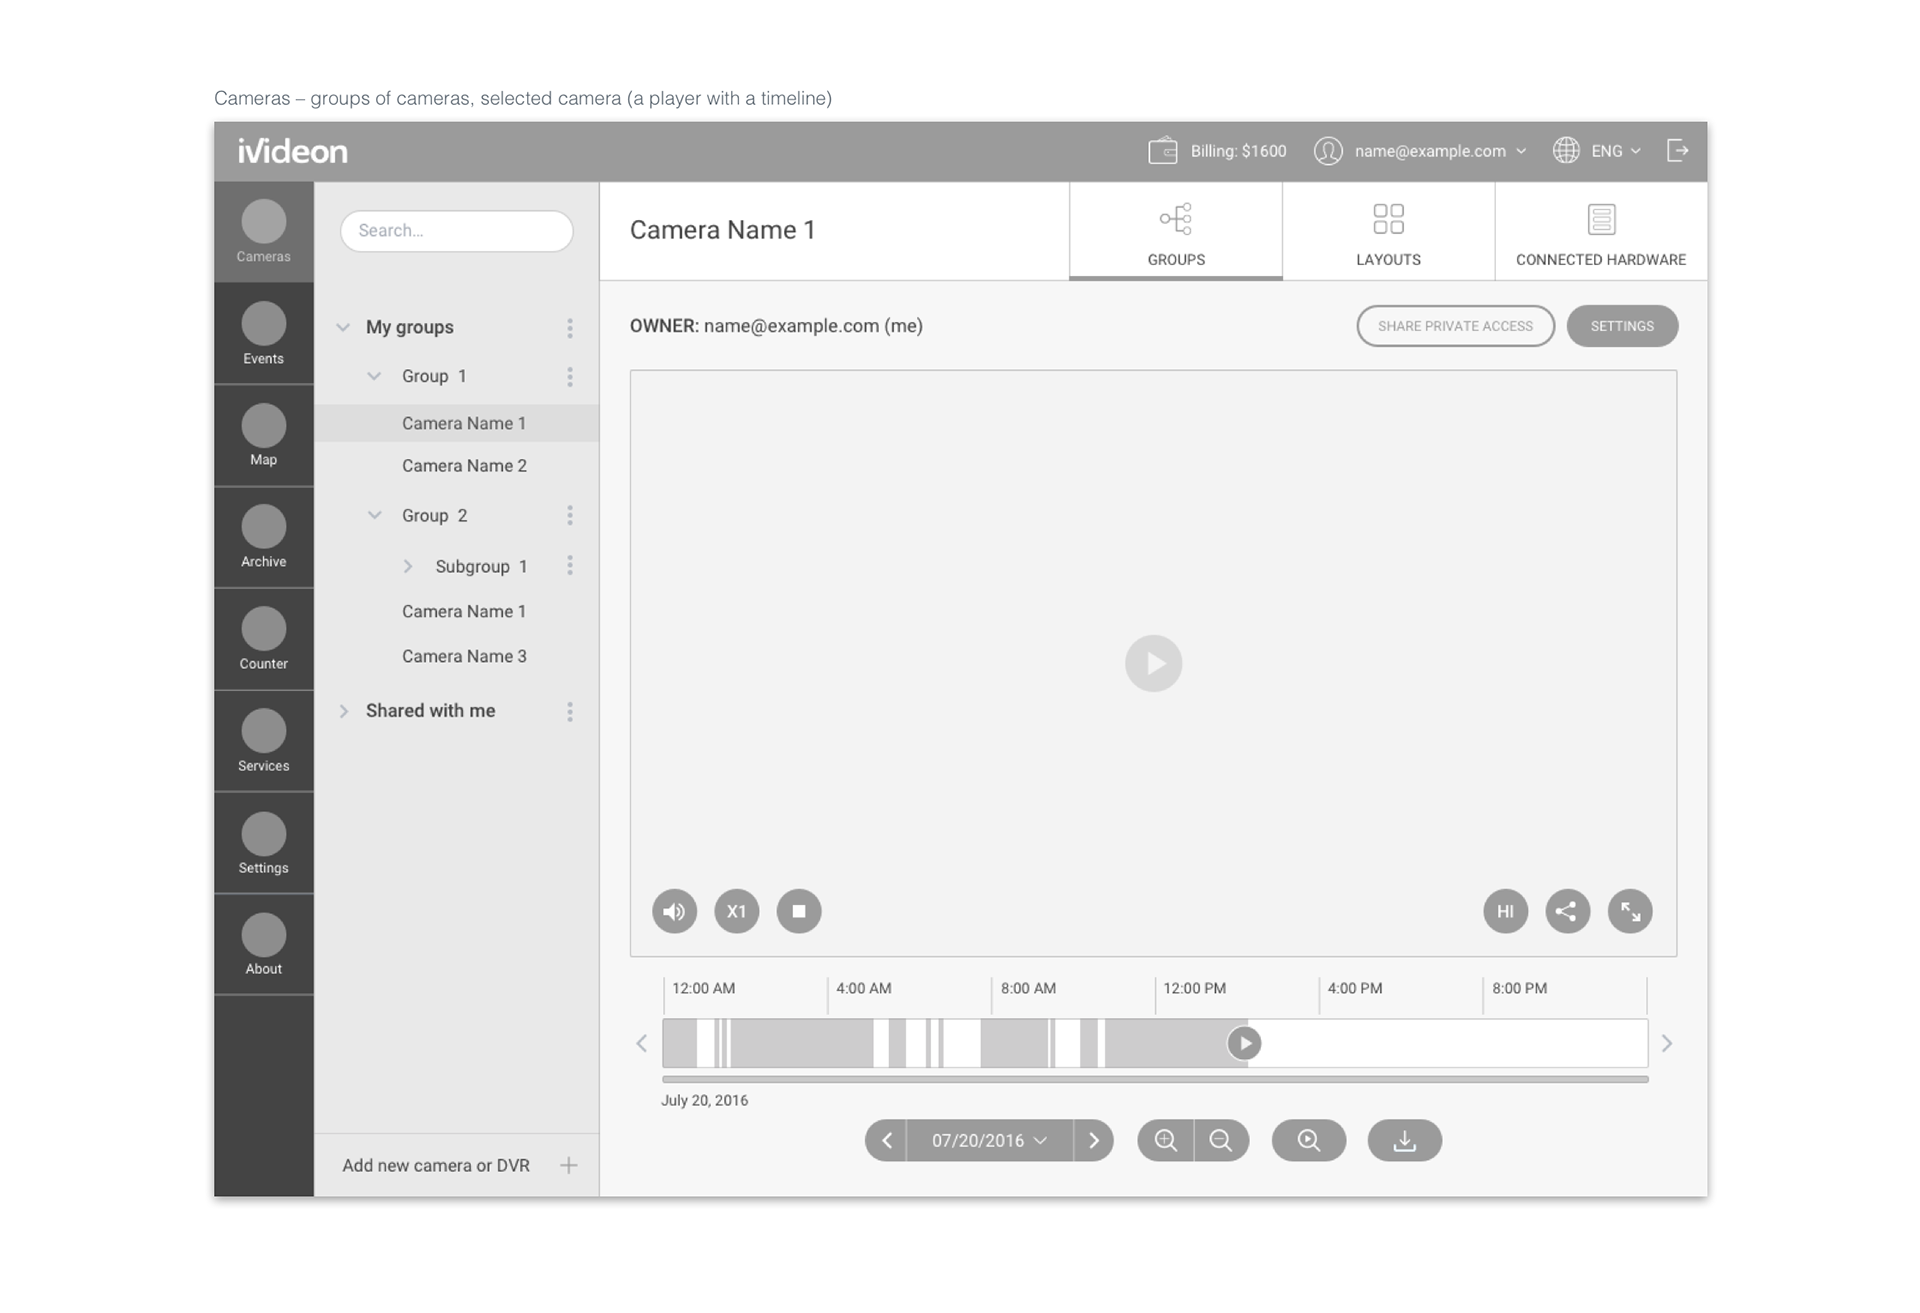
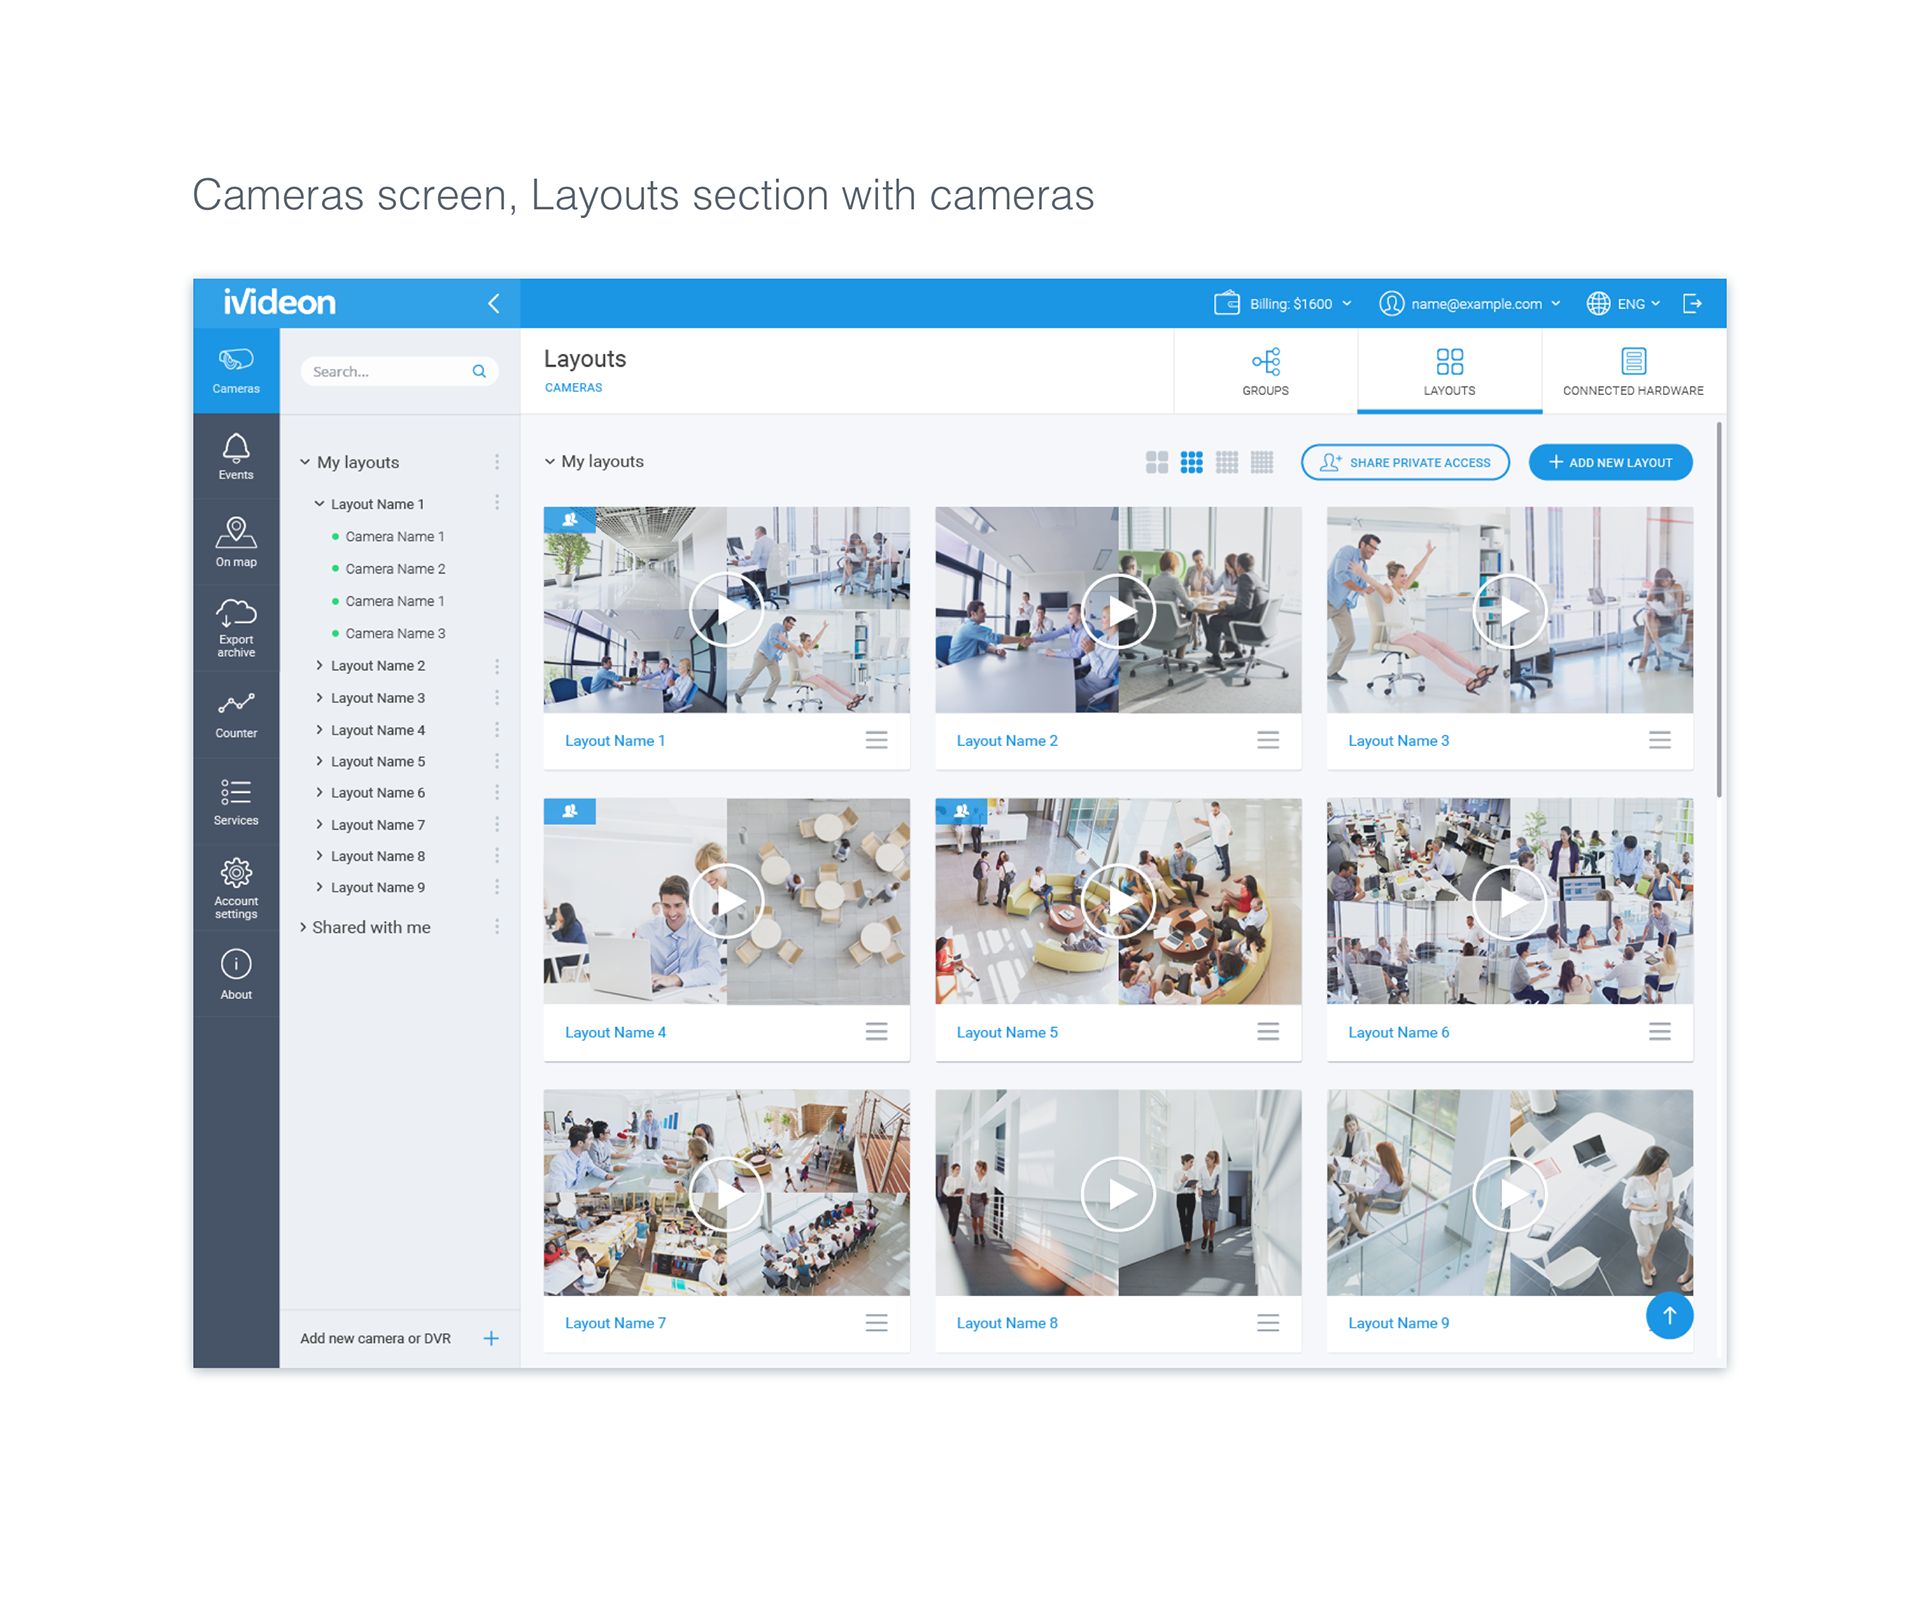
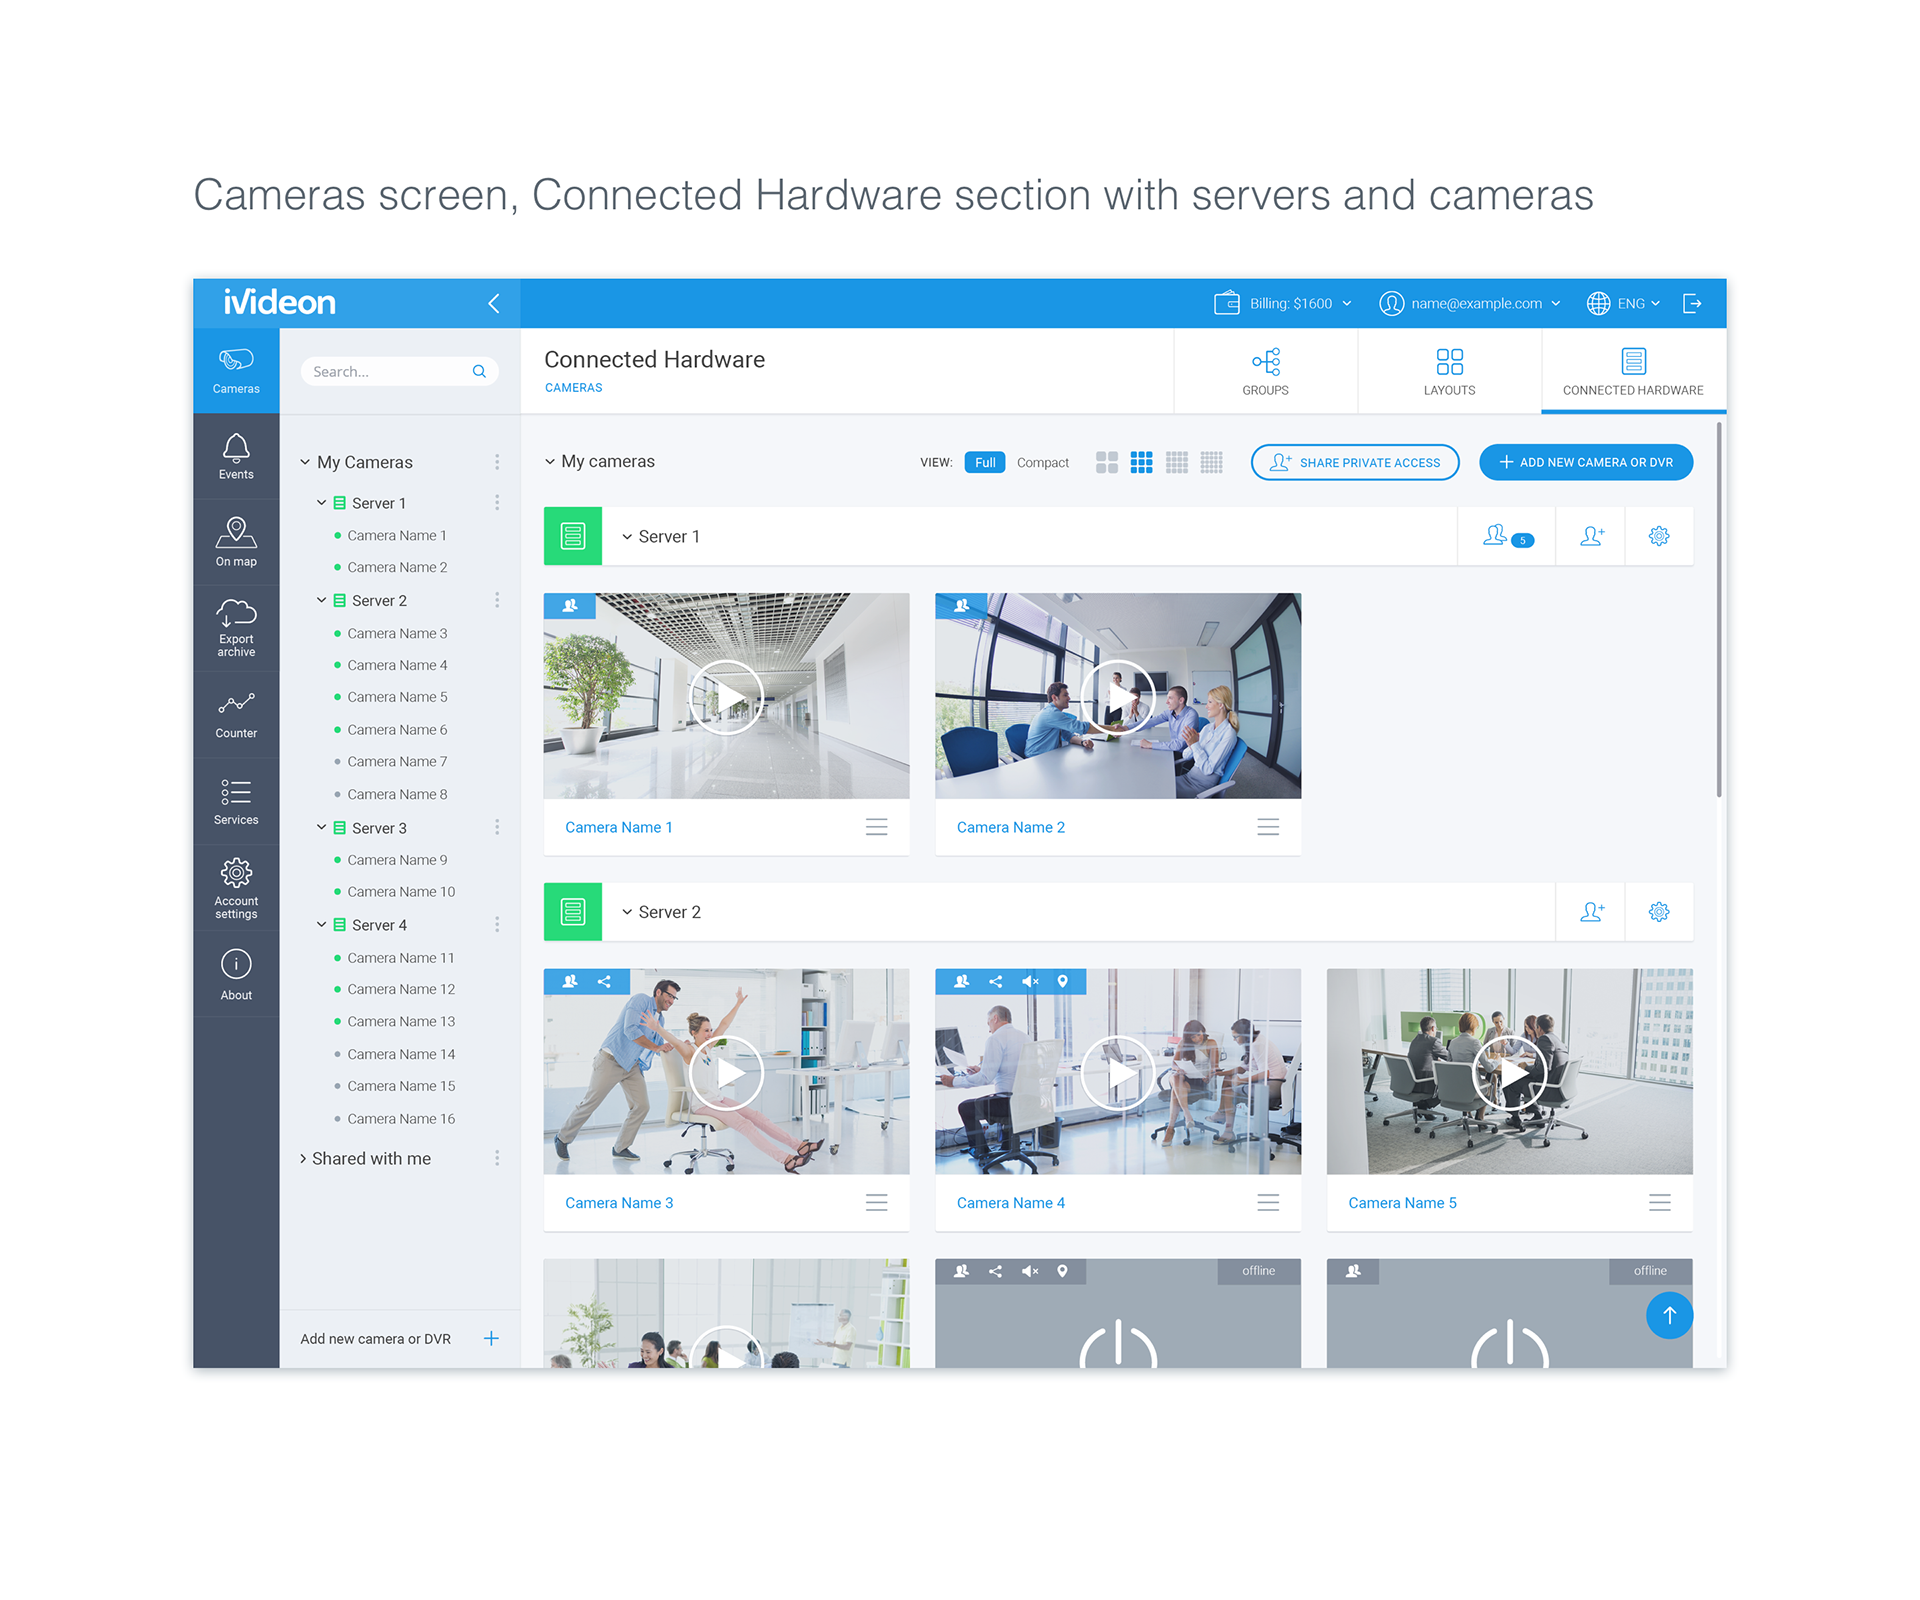
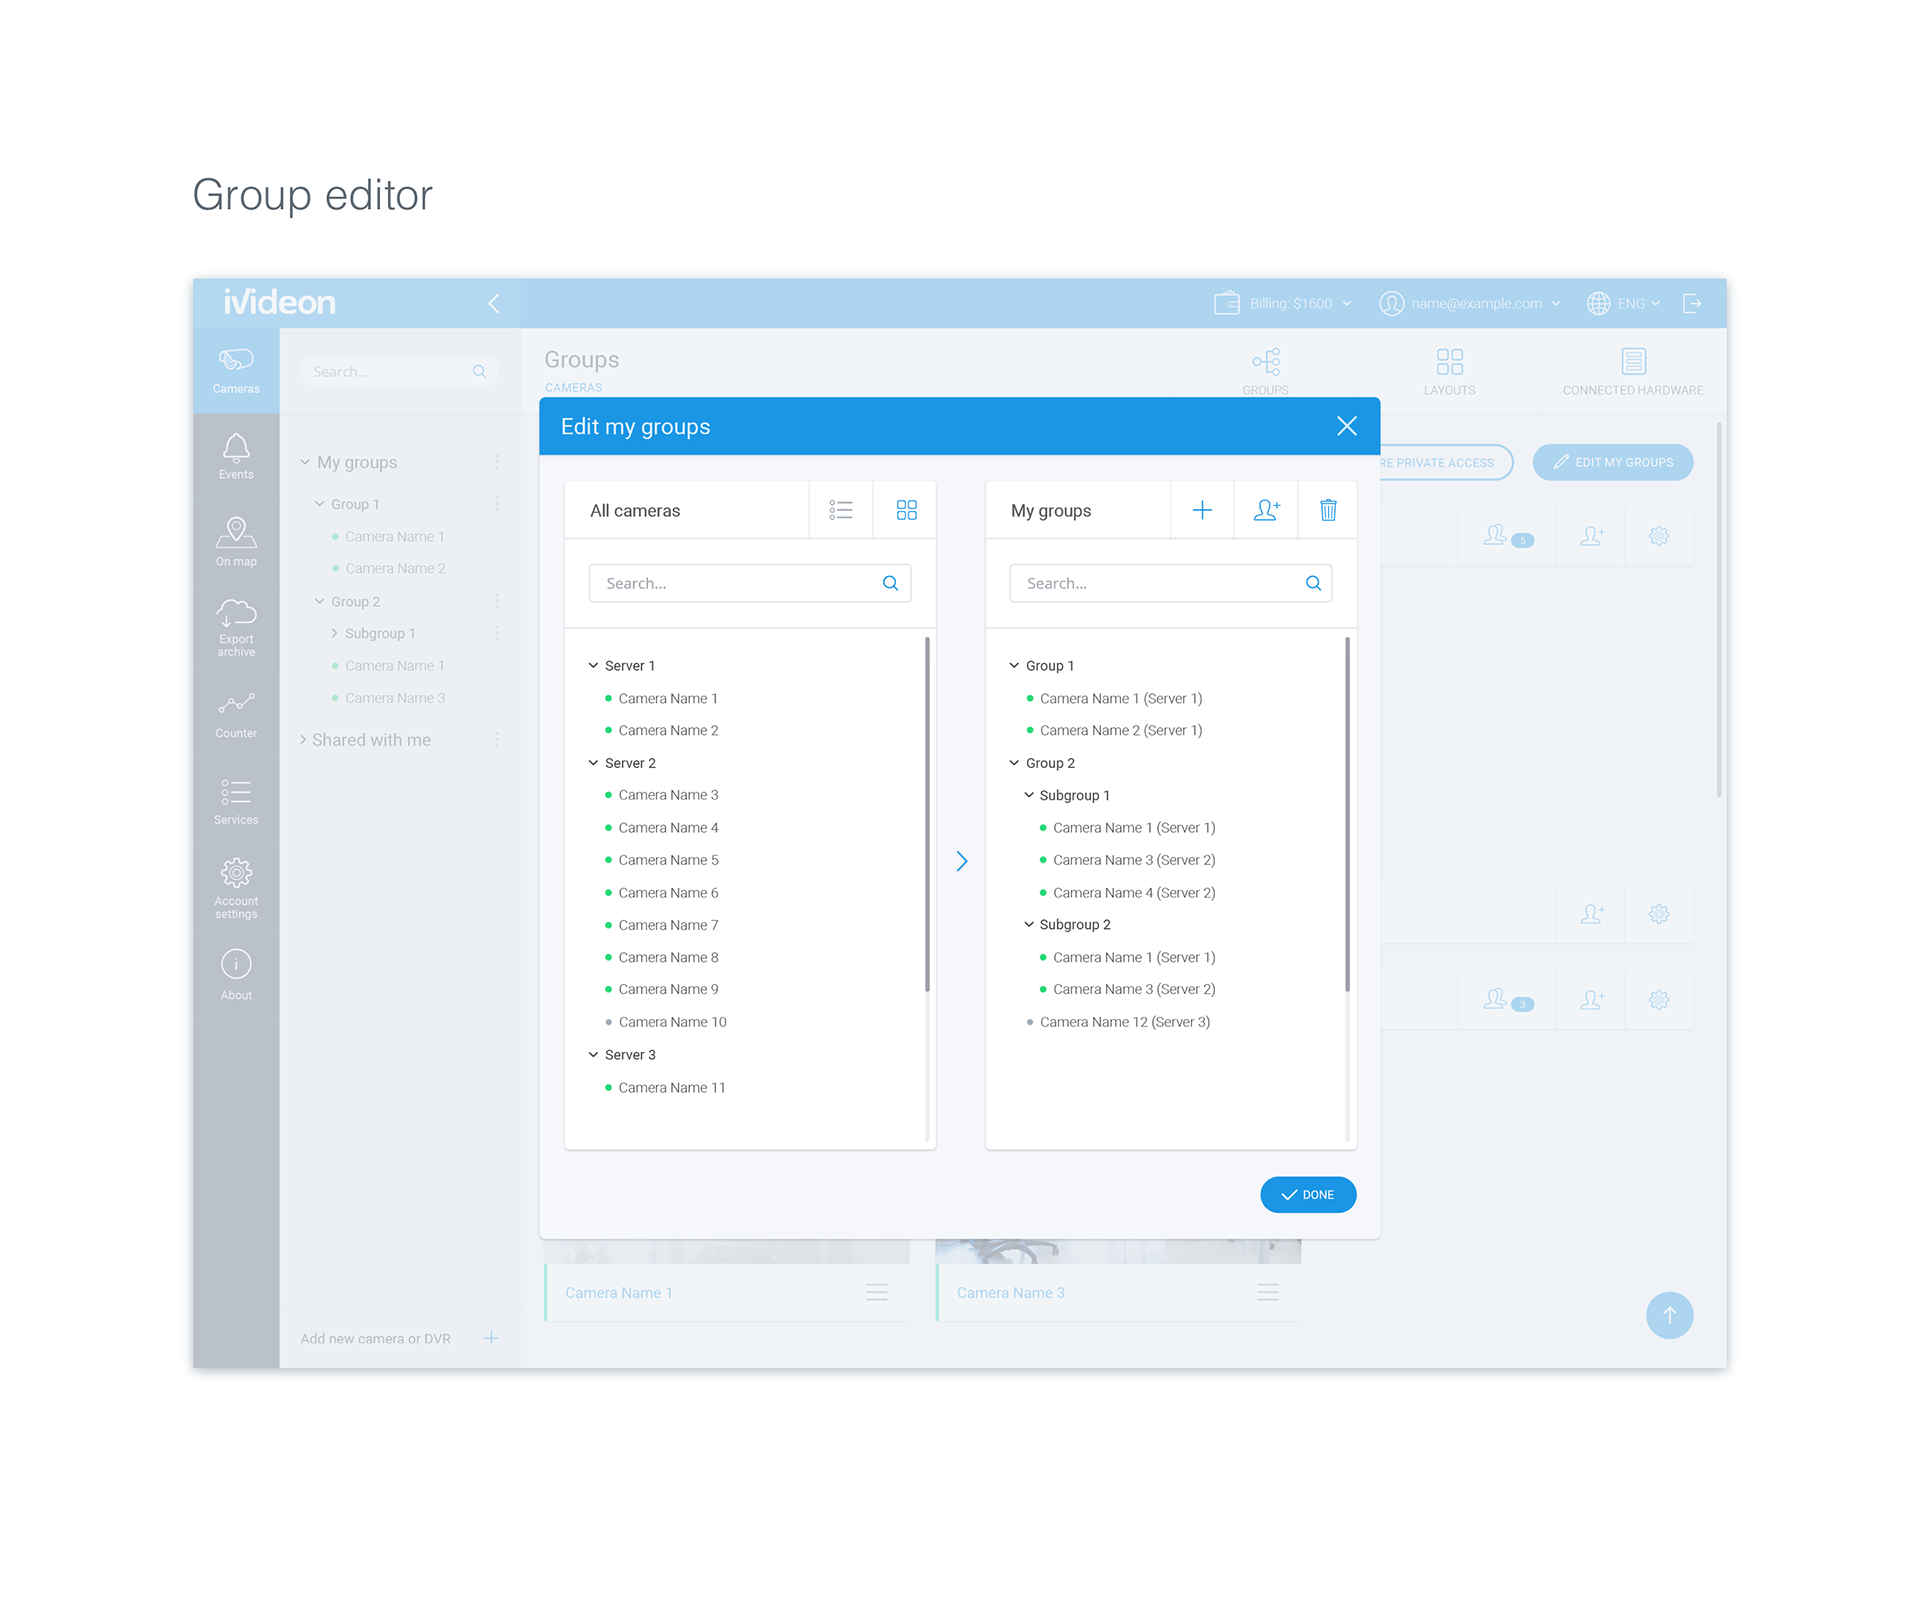
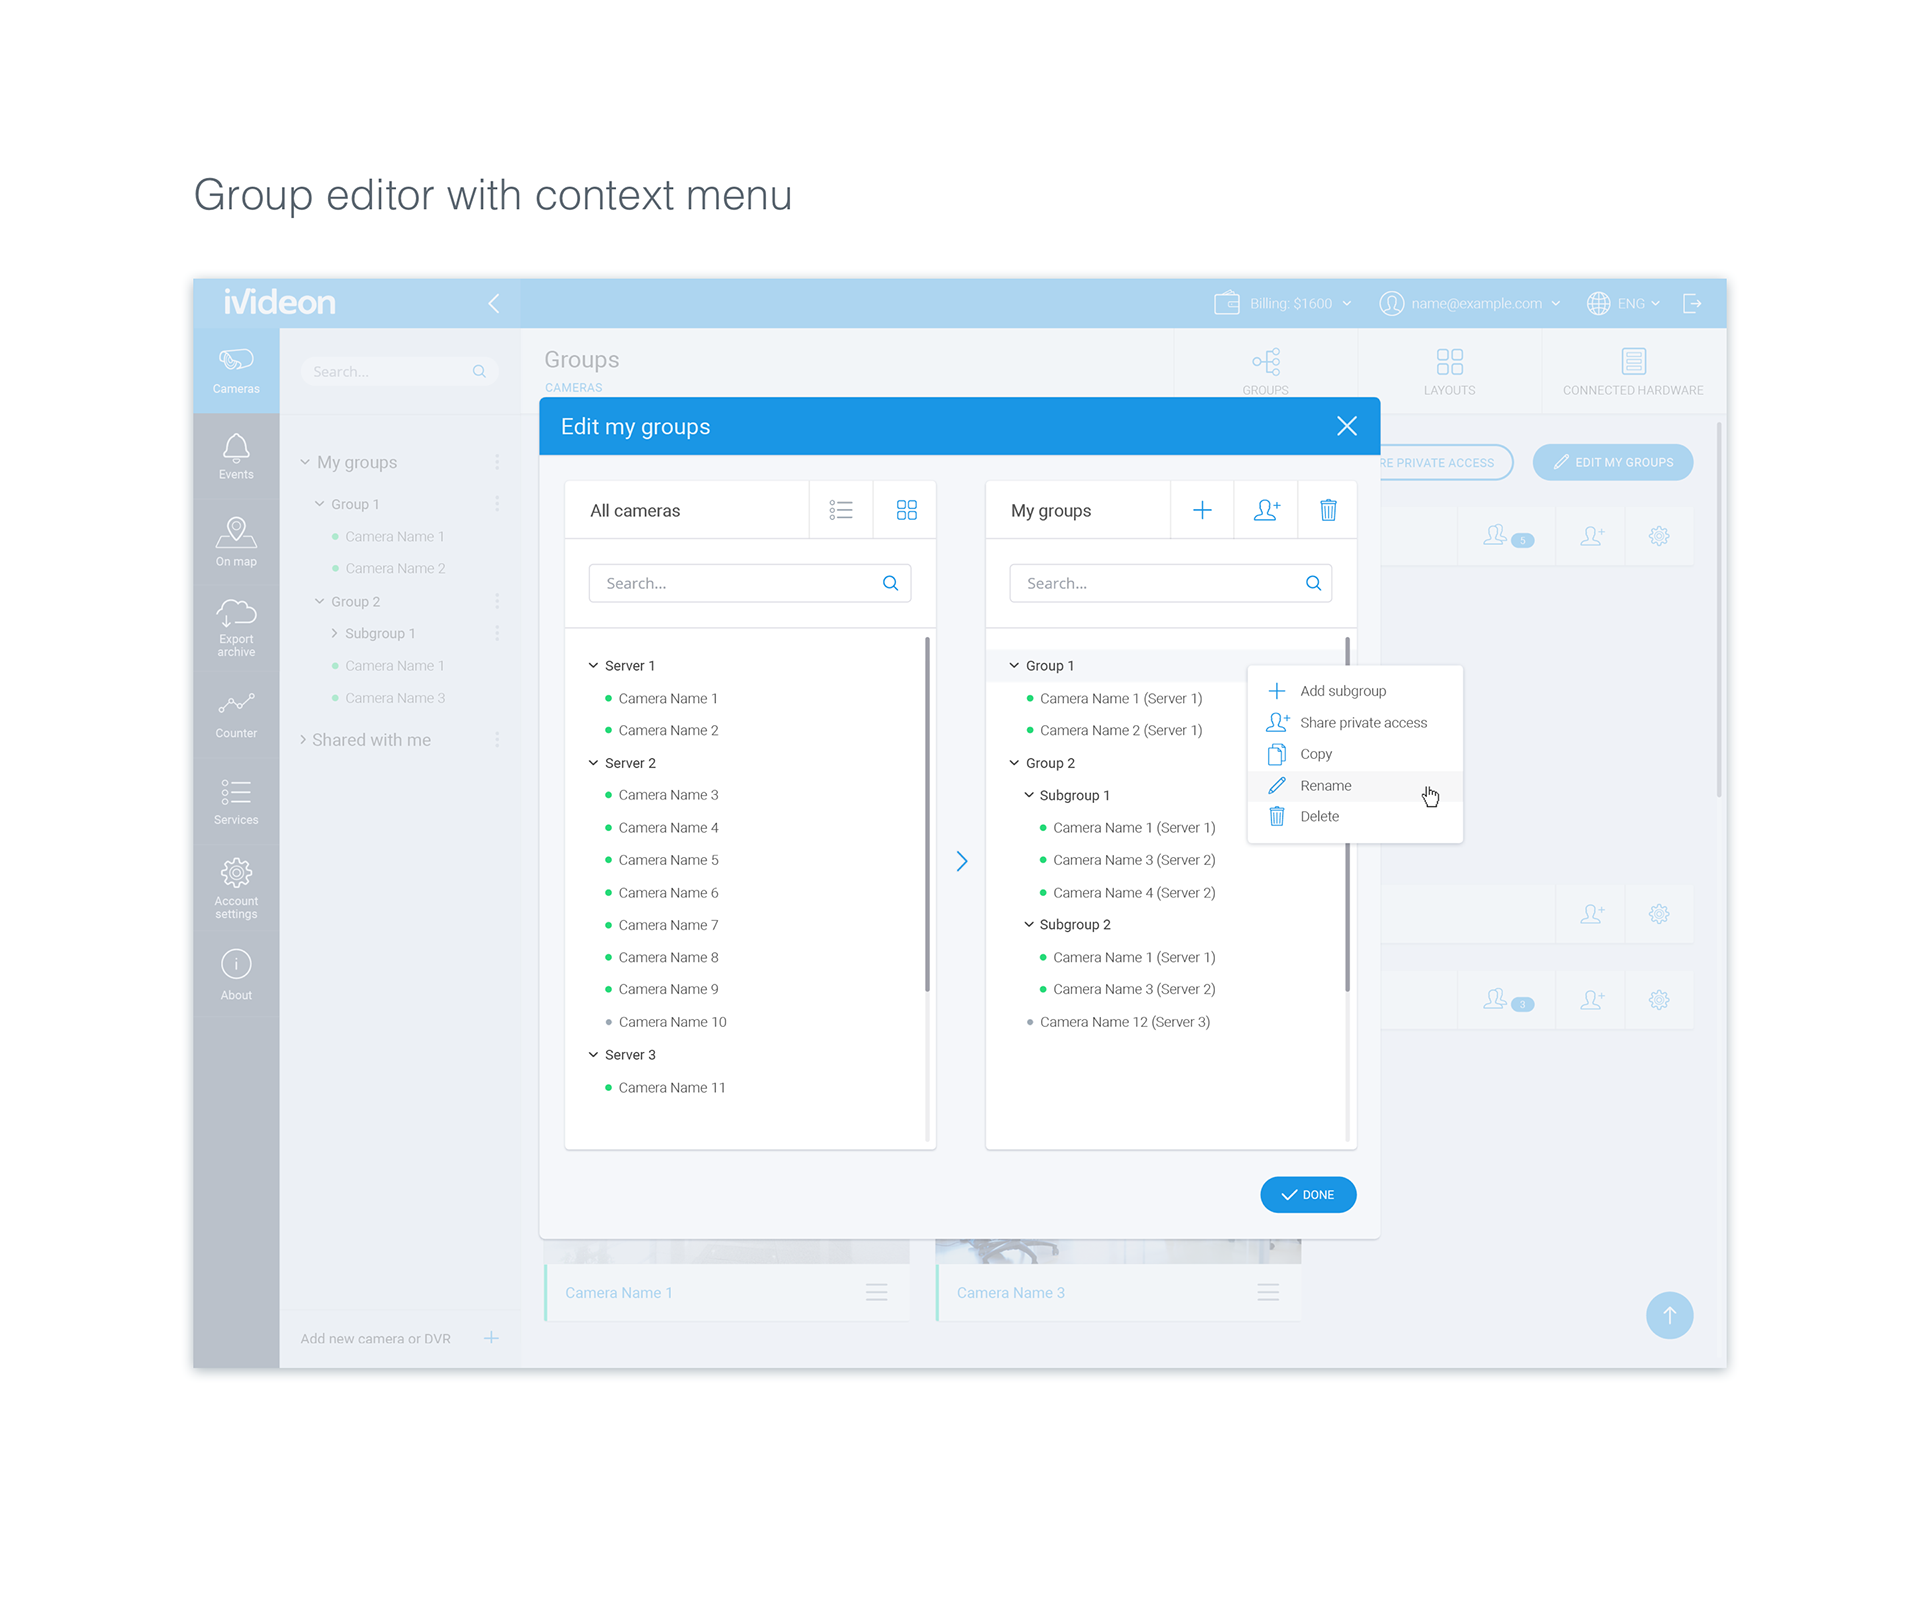
High-fidelity wireframes


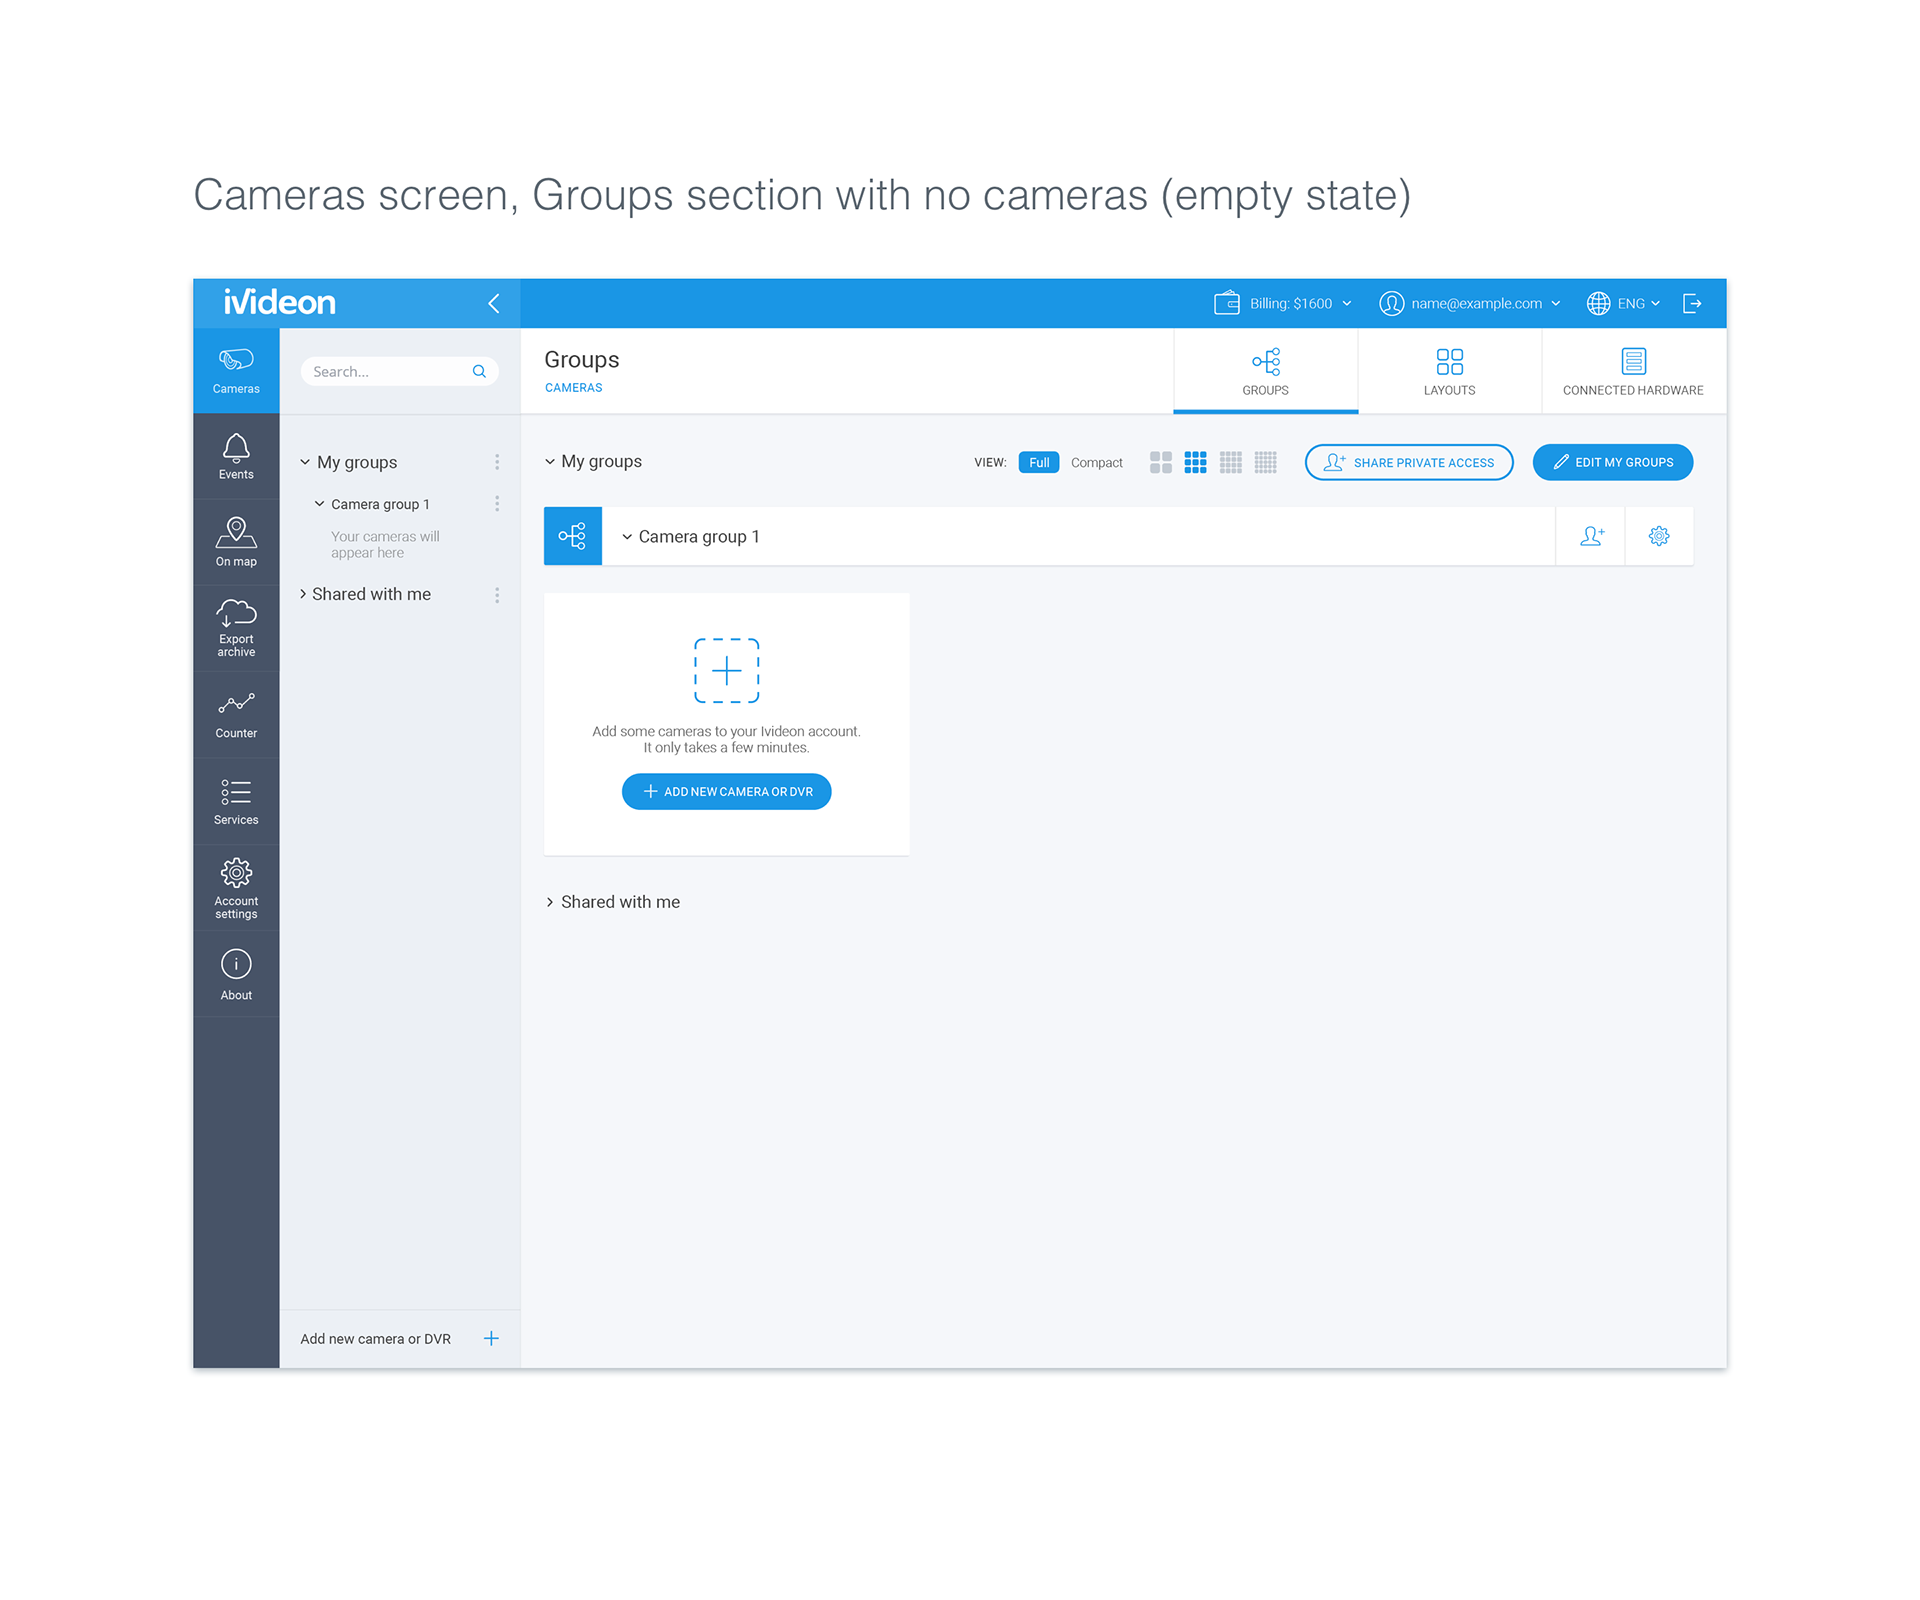
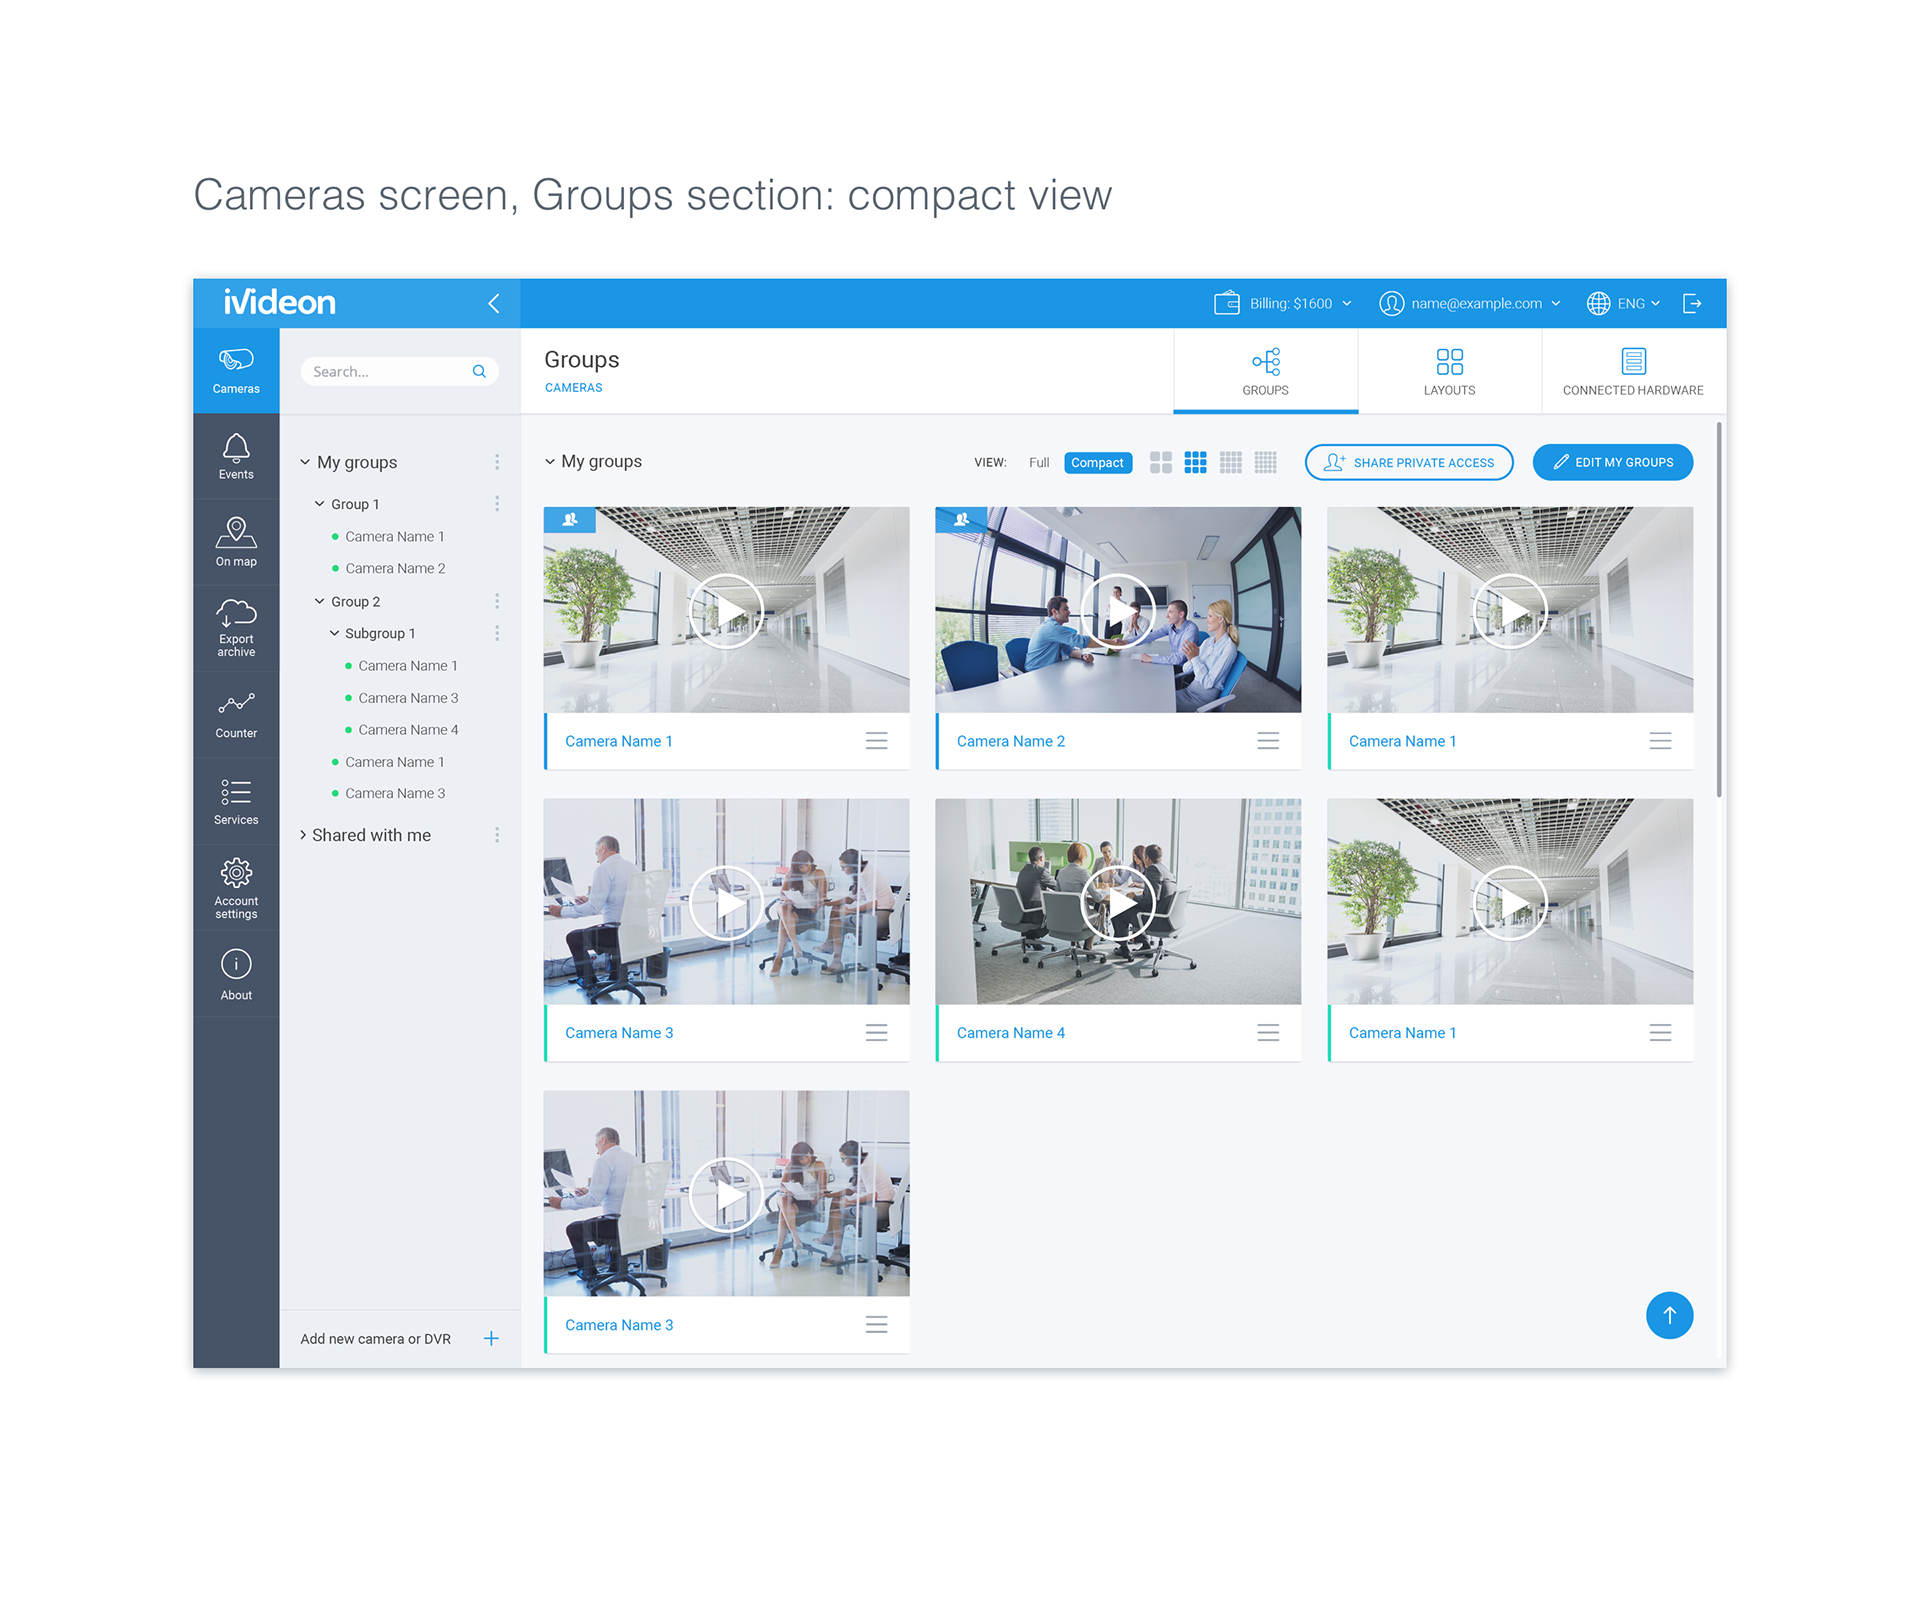
Final Designs








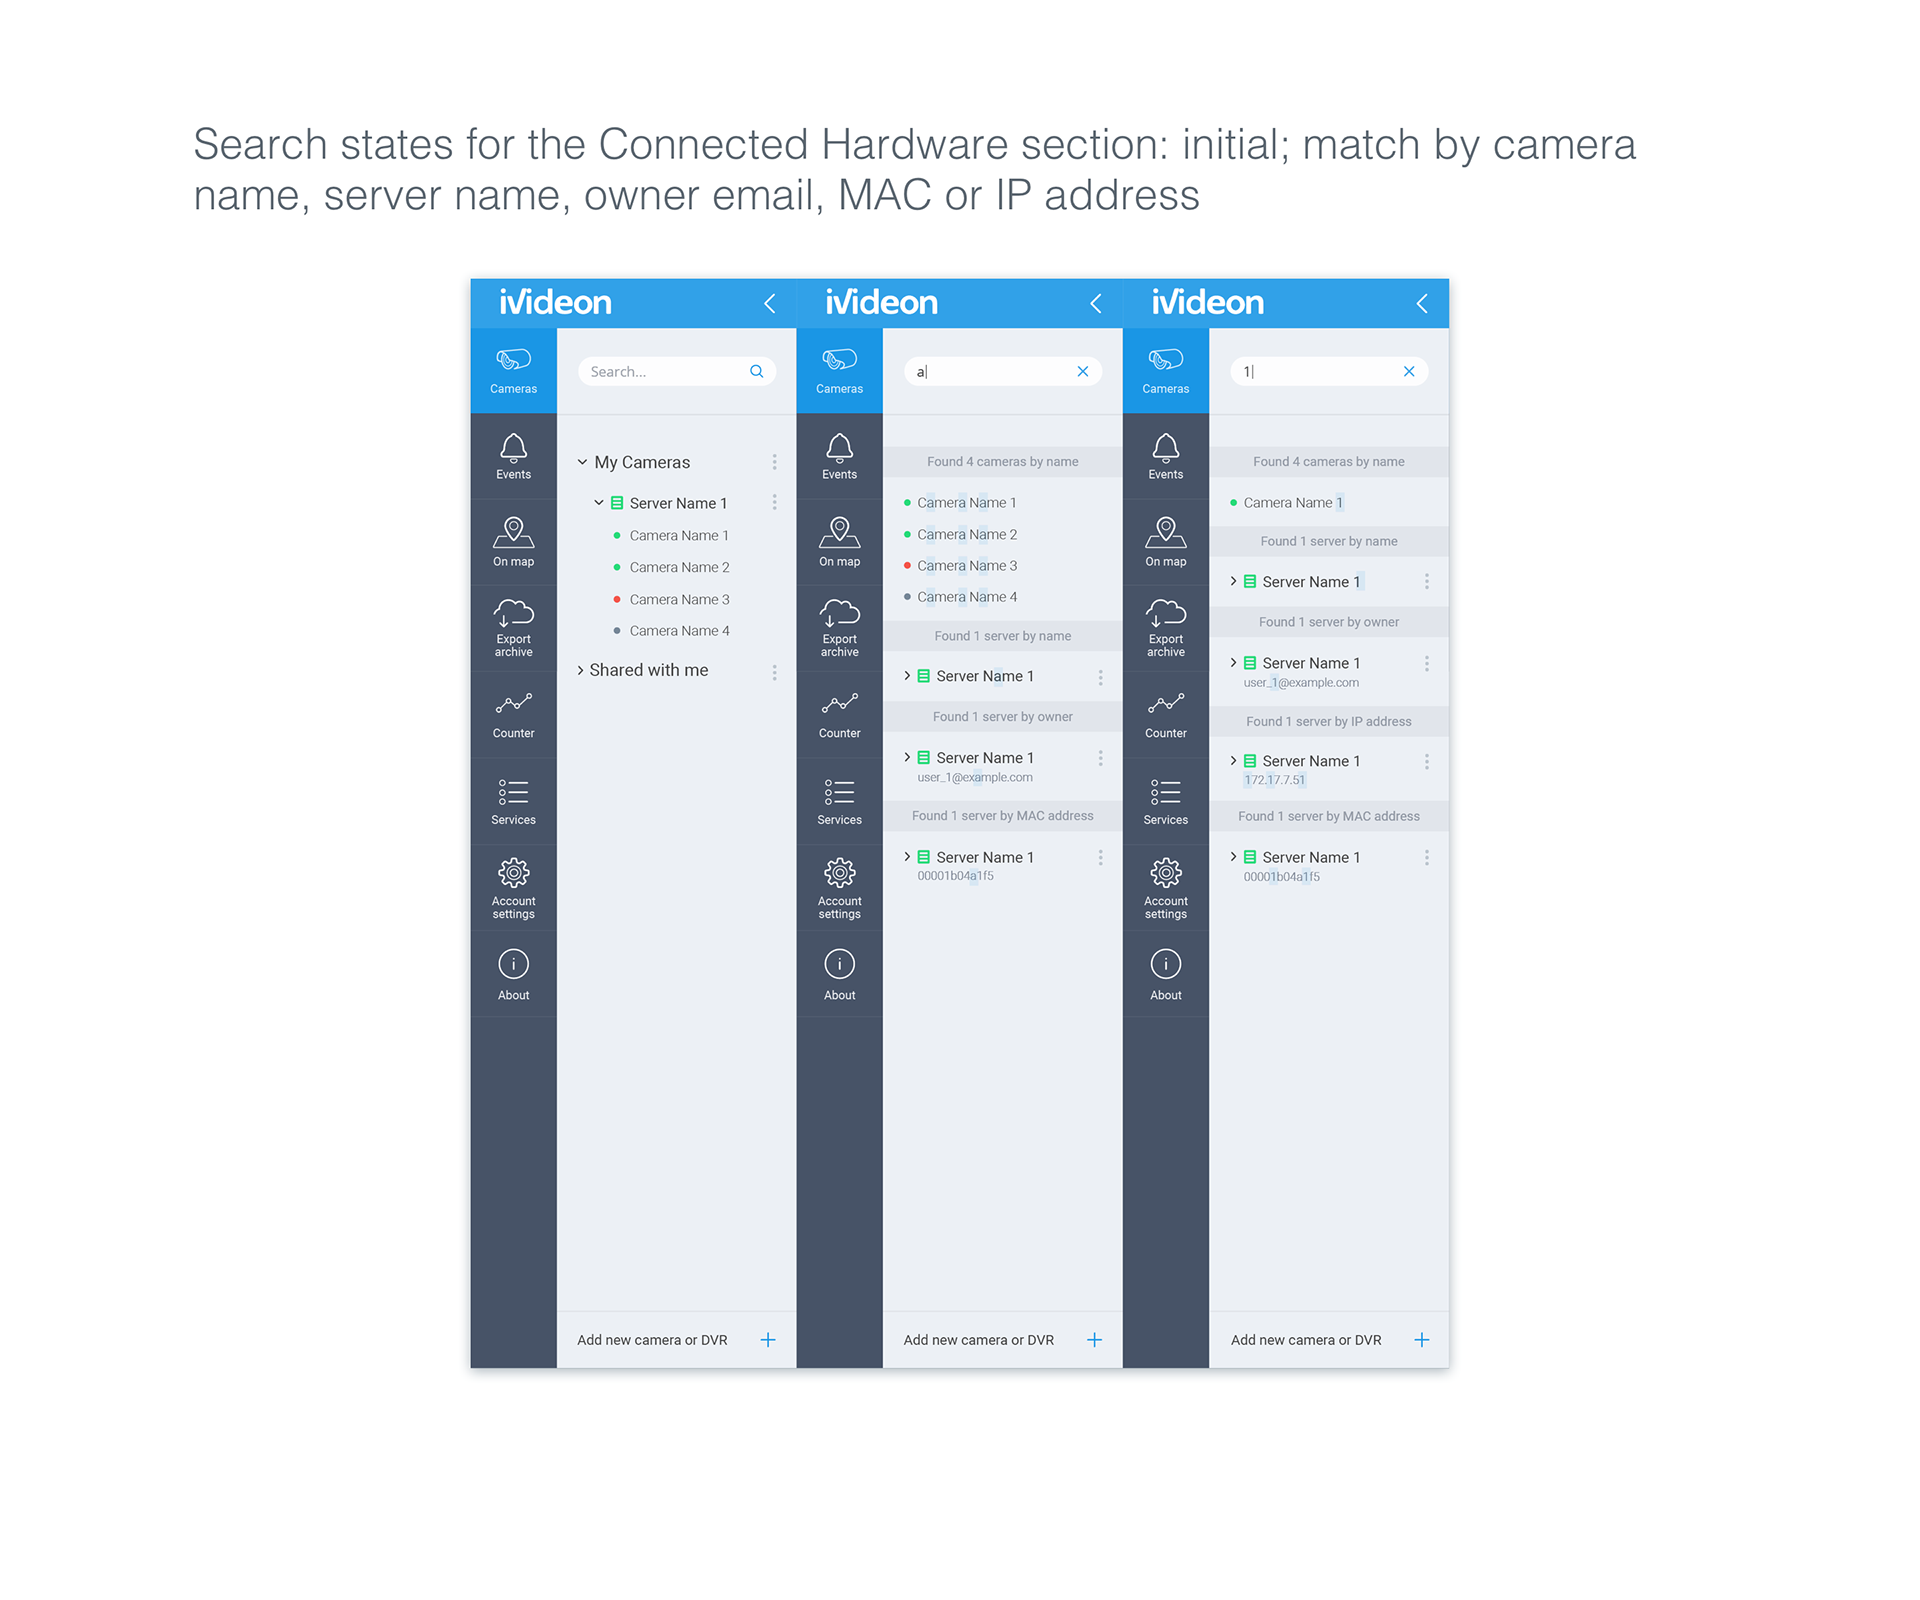
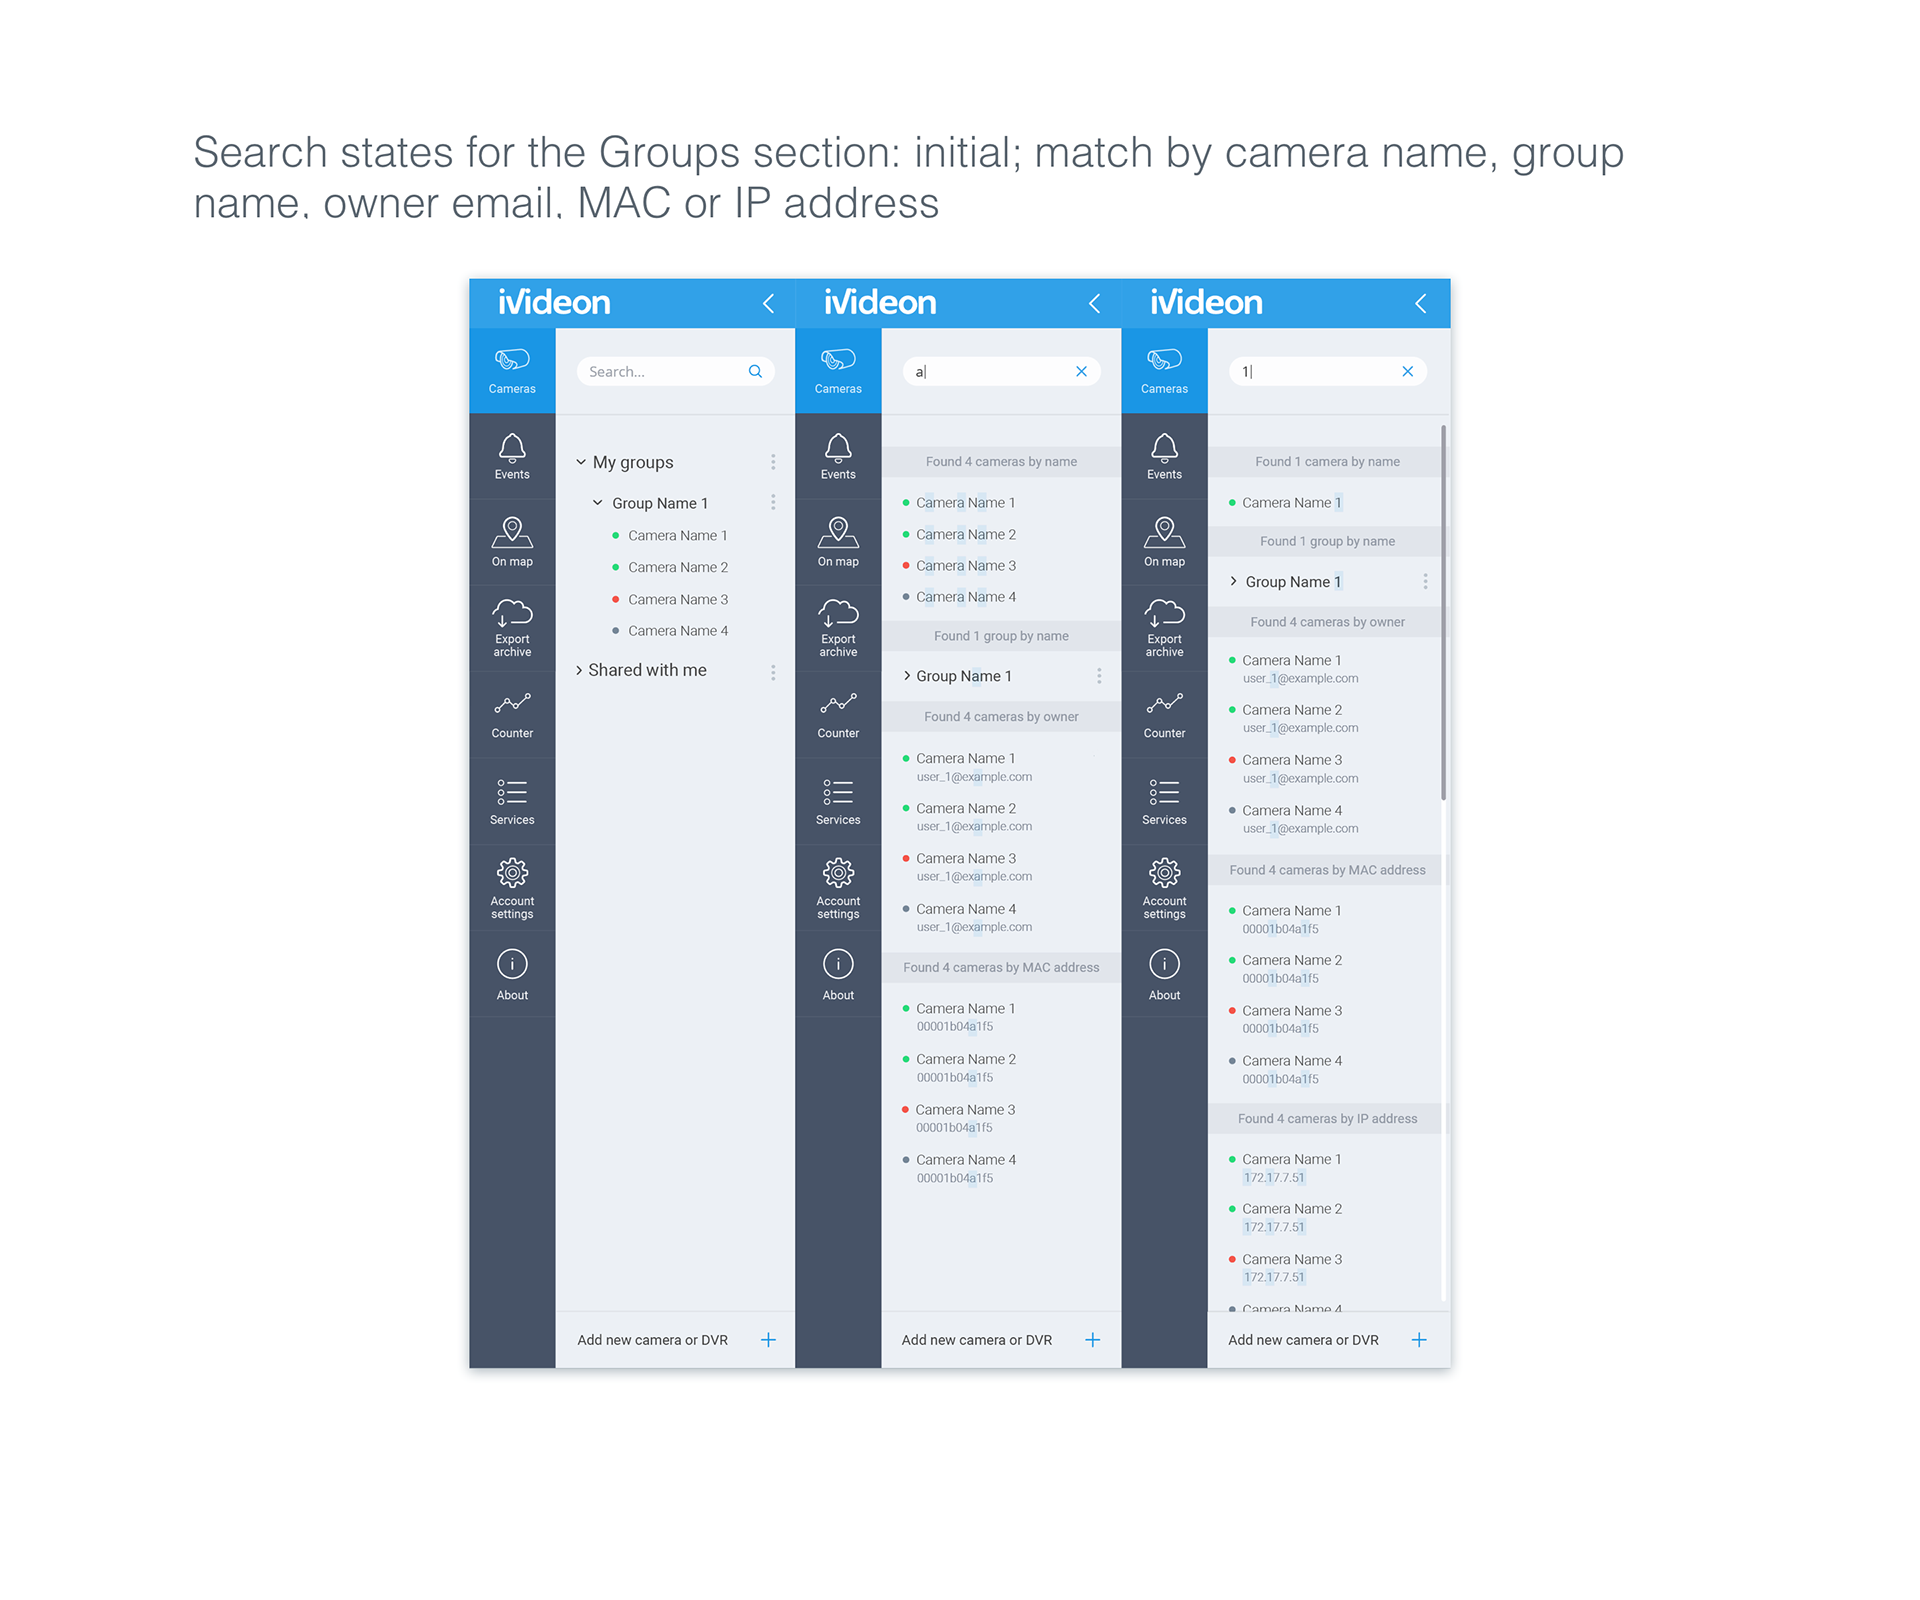

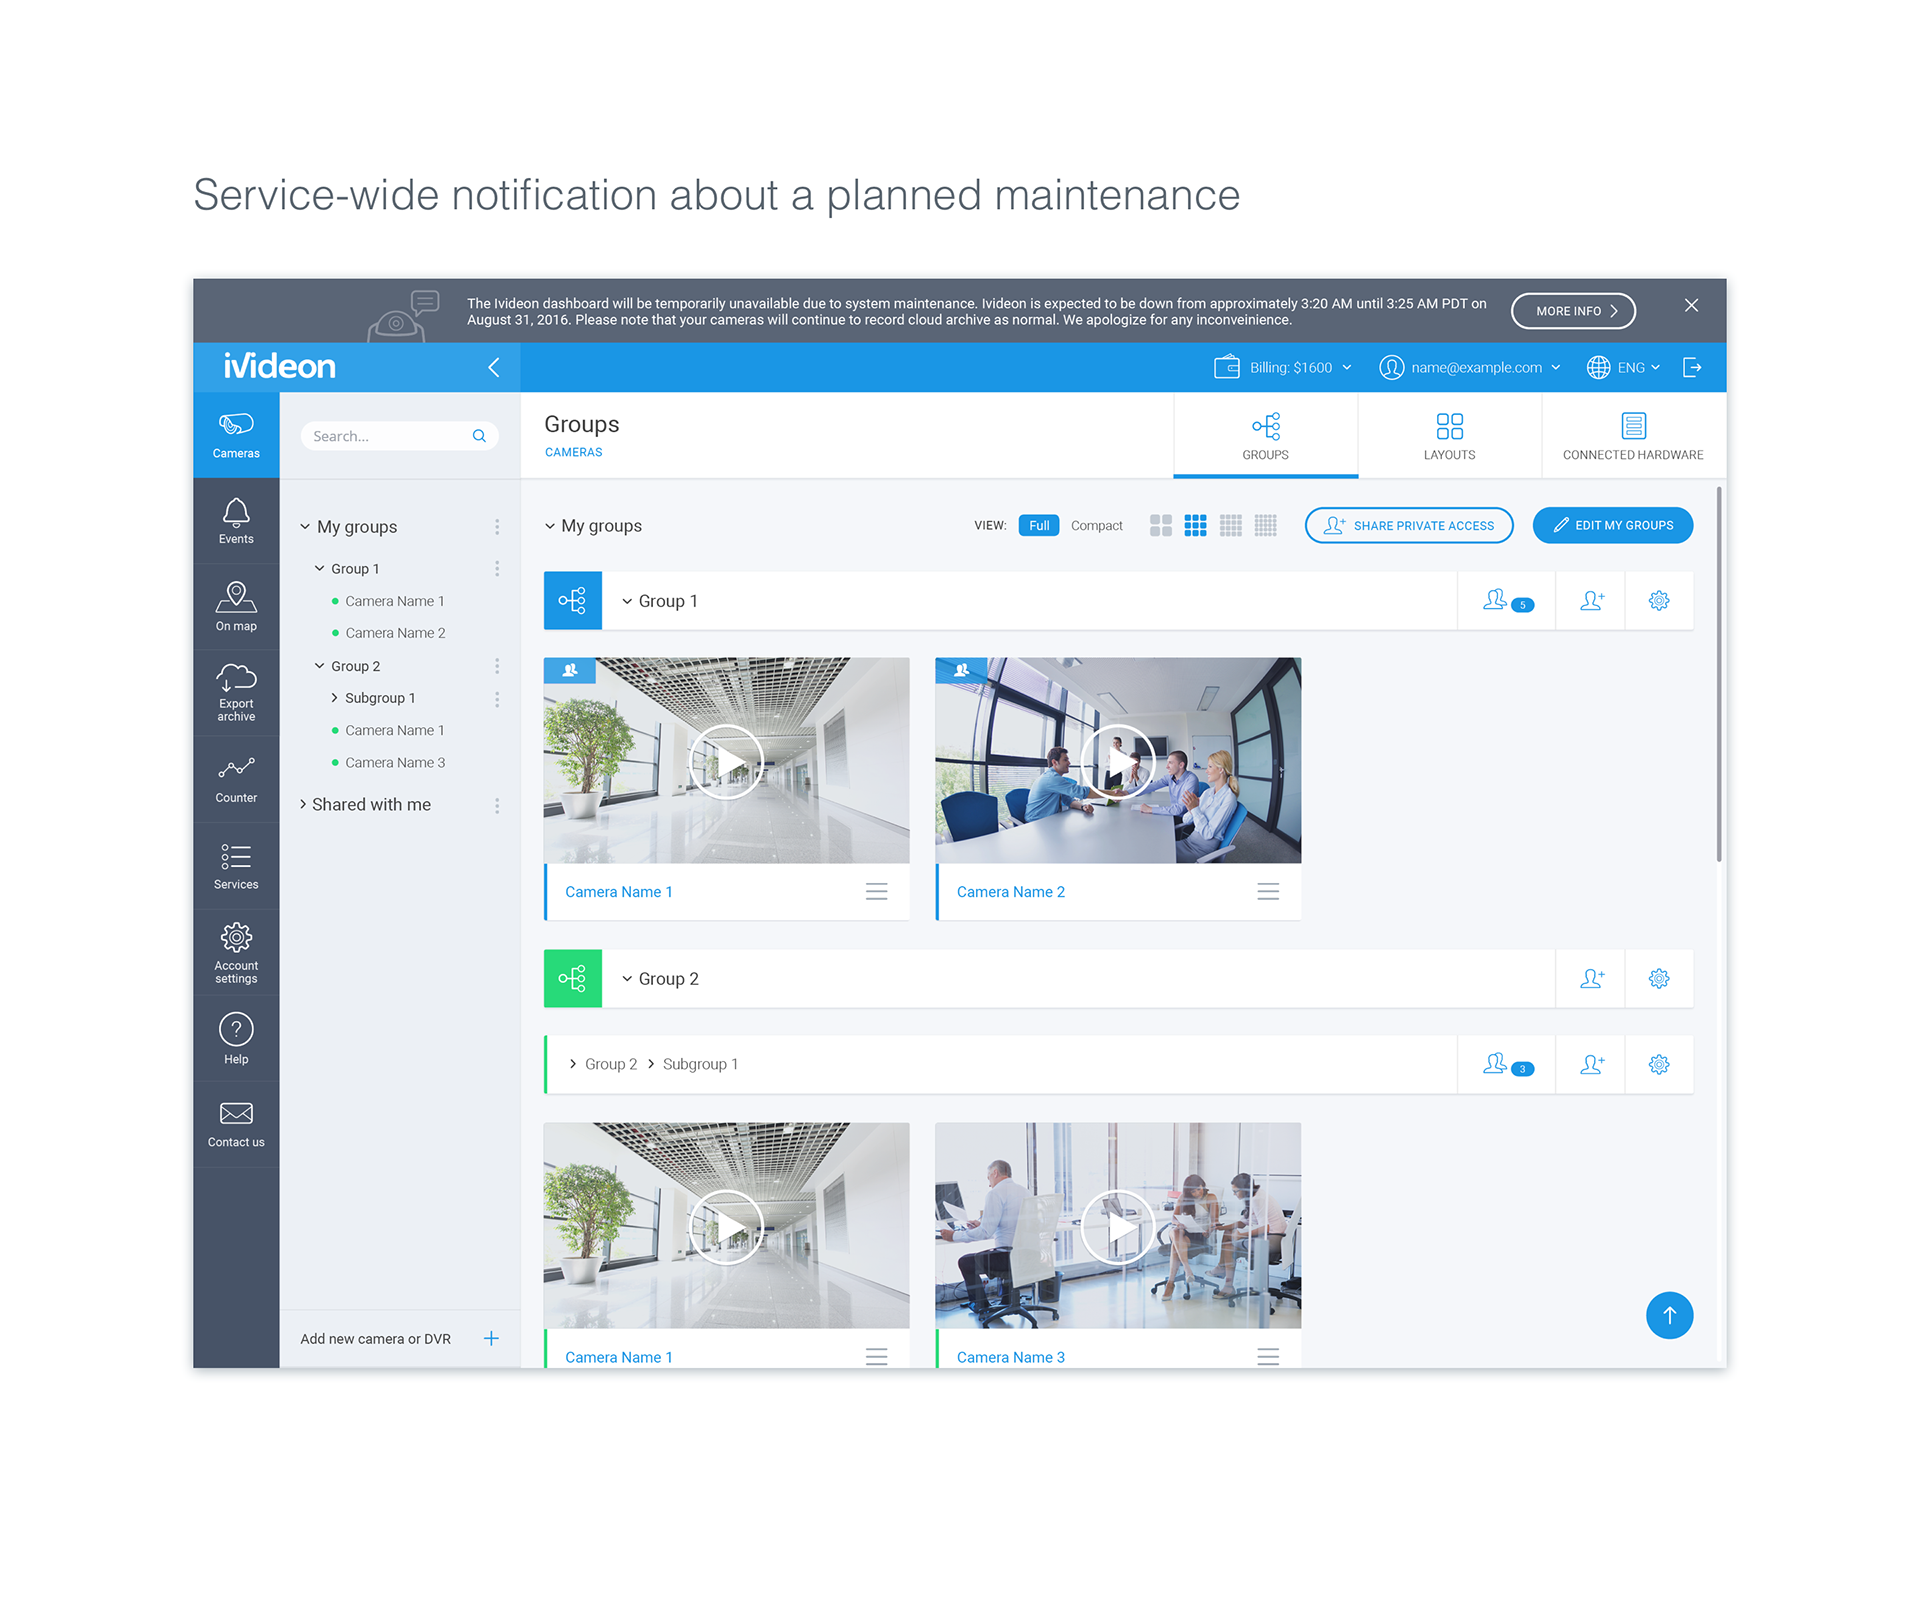


Camera Events
Goal: display the list of all events recorded by the cameras and the cloud.
Goal: display the list of all events recorded by the cameras and the cloud.
Camera Settings Dialog
Goal: configure any of your cameras securely from wherever you are without a hassle; the user should no longer need to be present near the camera, remember different IP addresses, passwords, use complex and inconsistent on-camera UIs.
Goal: configure any of your cameras securely from wherever you are without a hassle; the user should no longer need to be present near the camera, remember different IP addresses, passwords, use complex and inconsistent on-camera UIs.
Inconsistent on-camera web configuration interfaces of different camera manufacturers
Camera configuration UI in the Ivideon Web Dashboard.
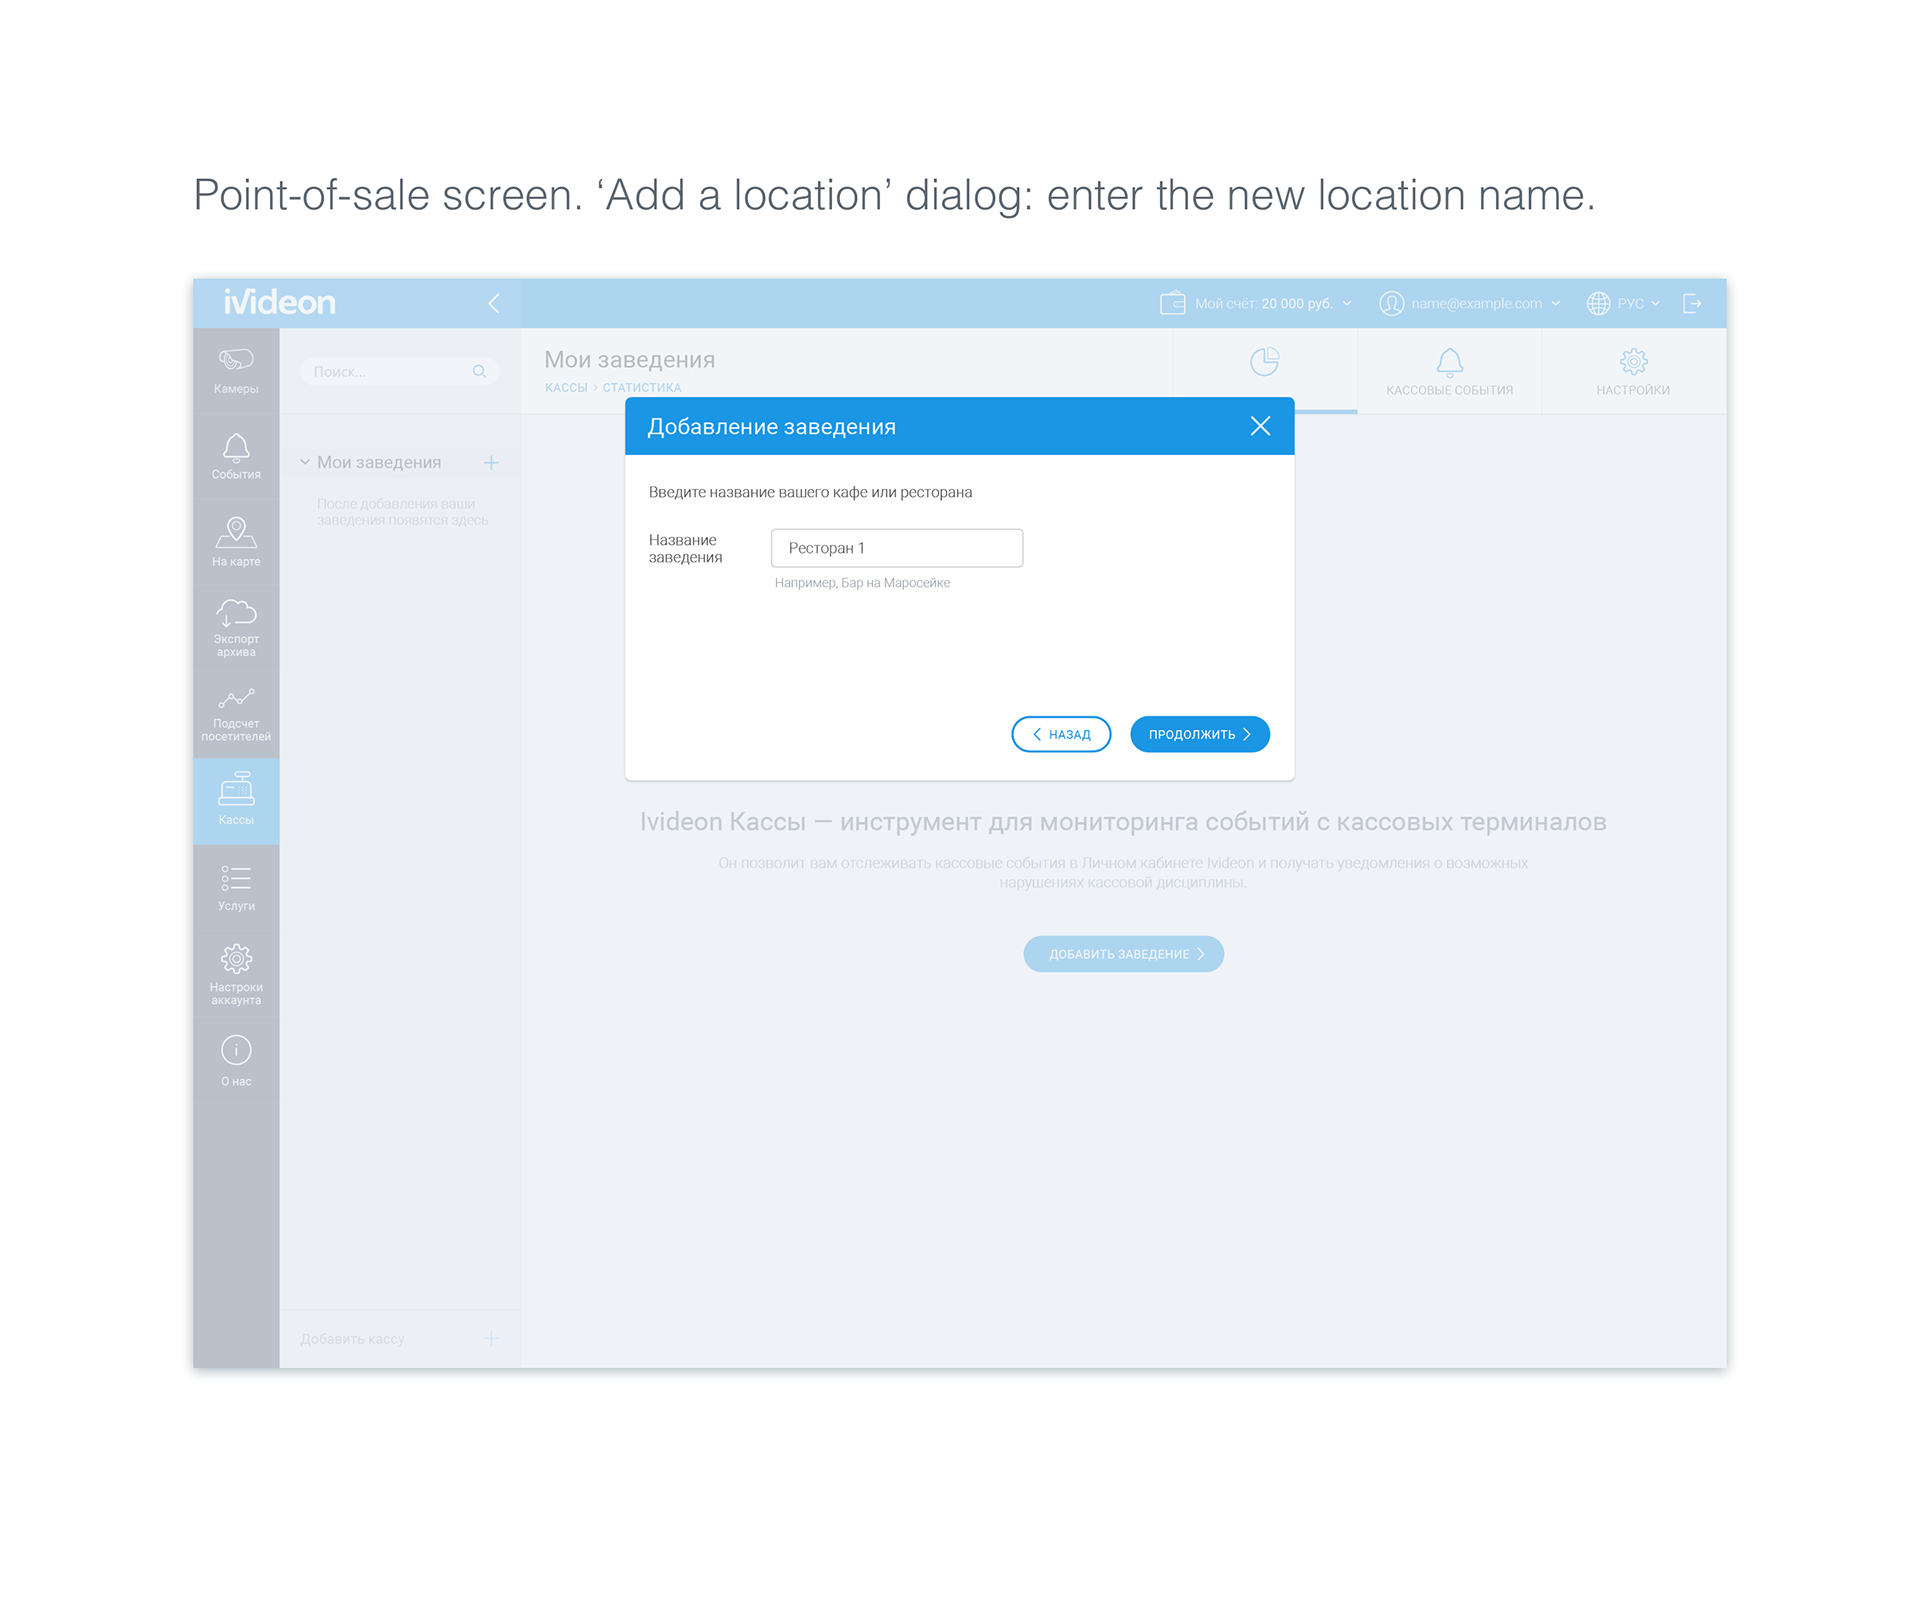
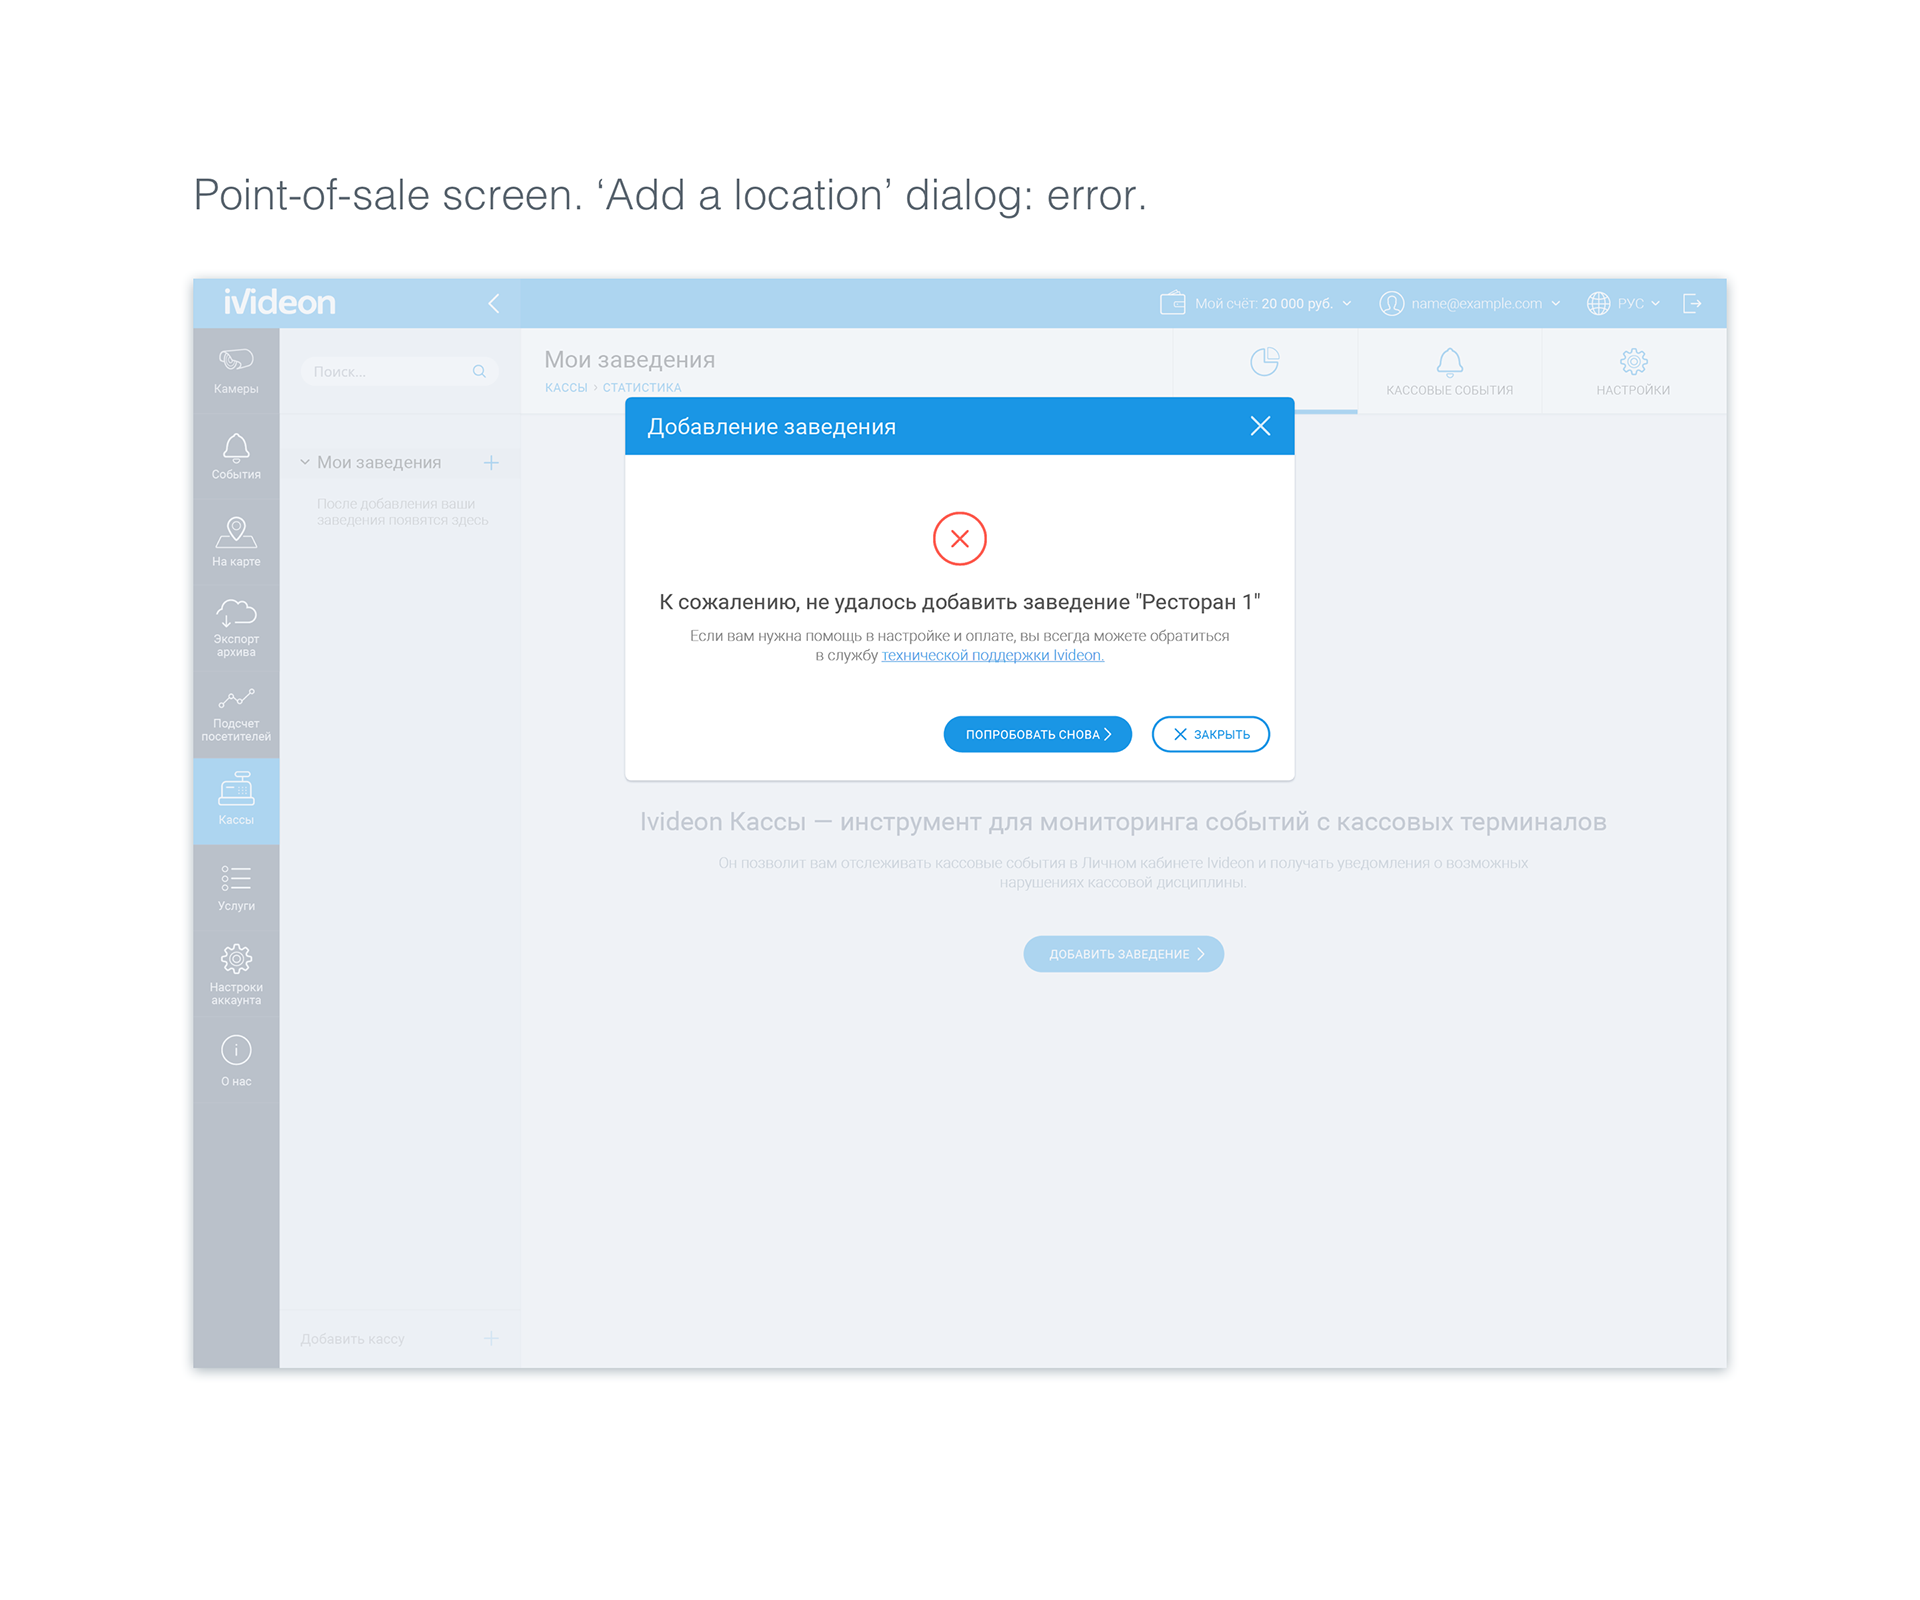
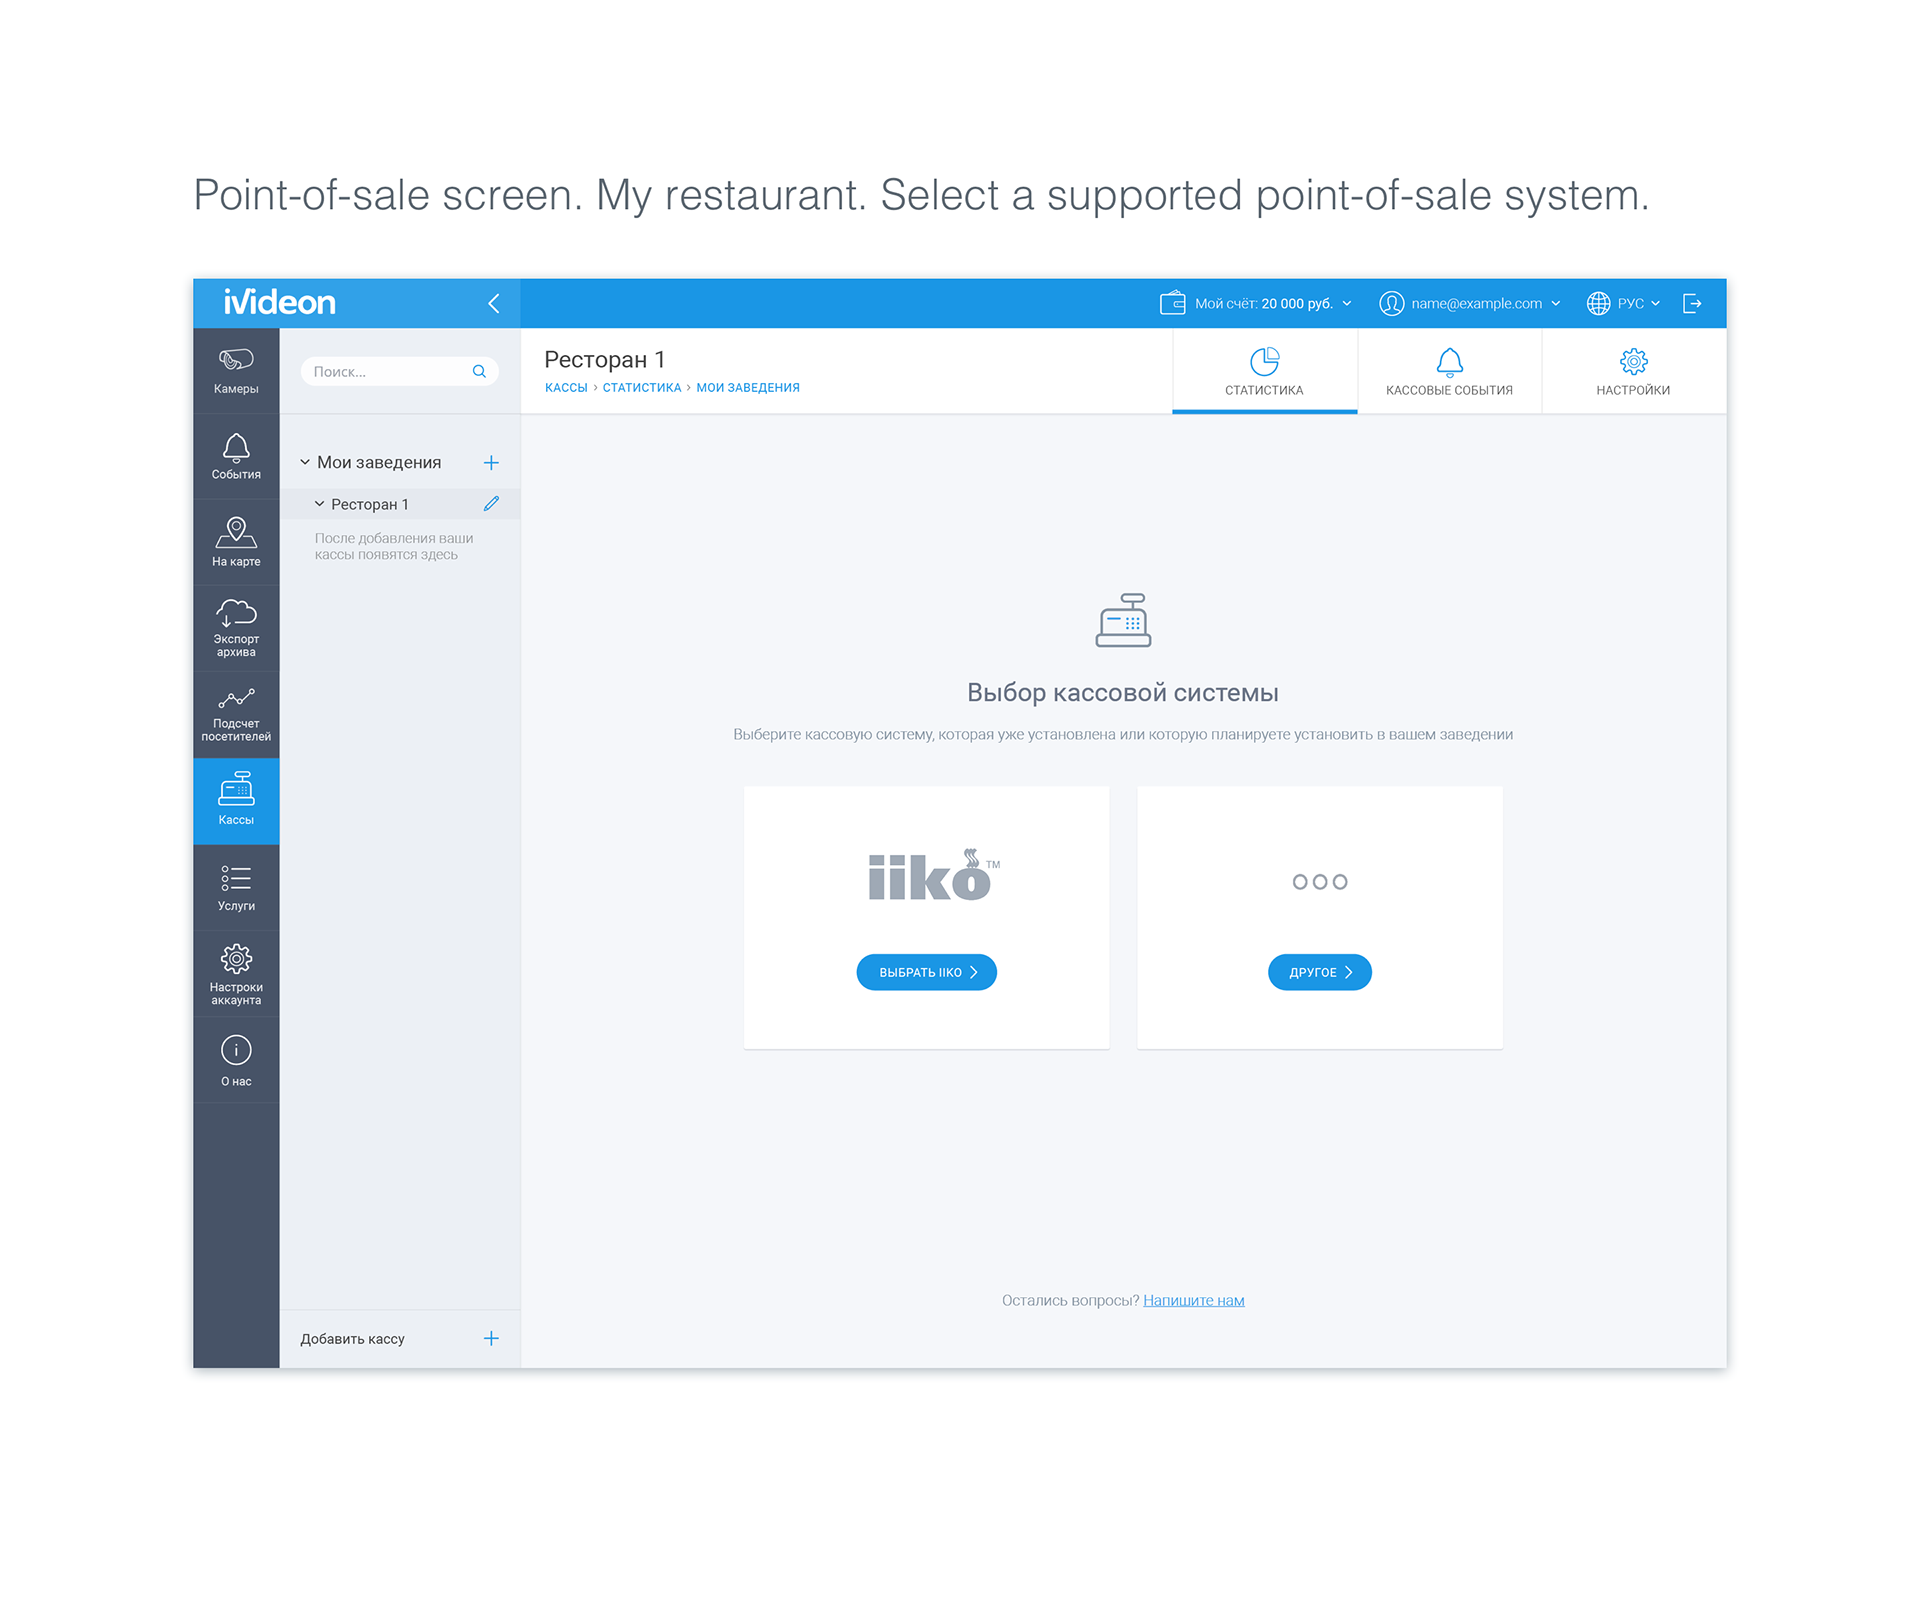
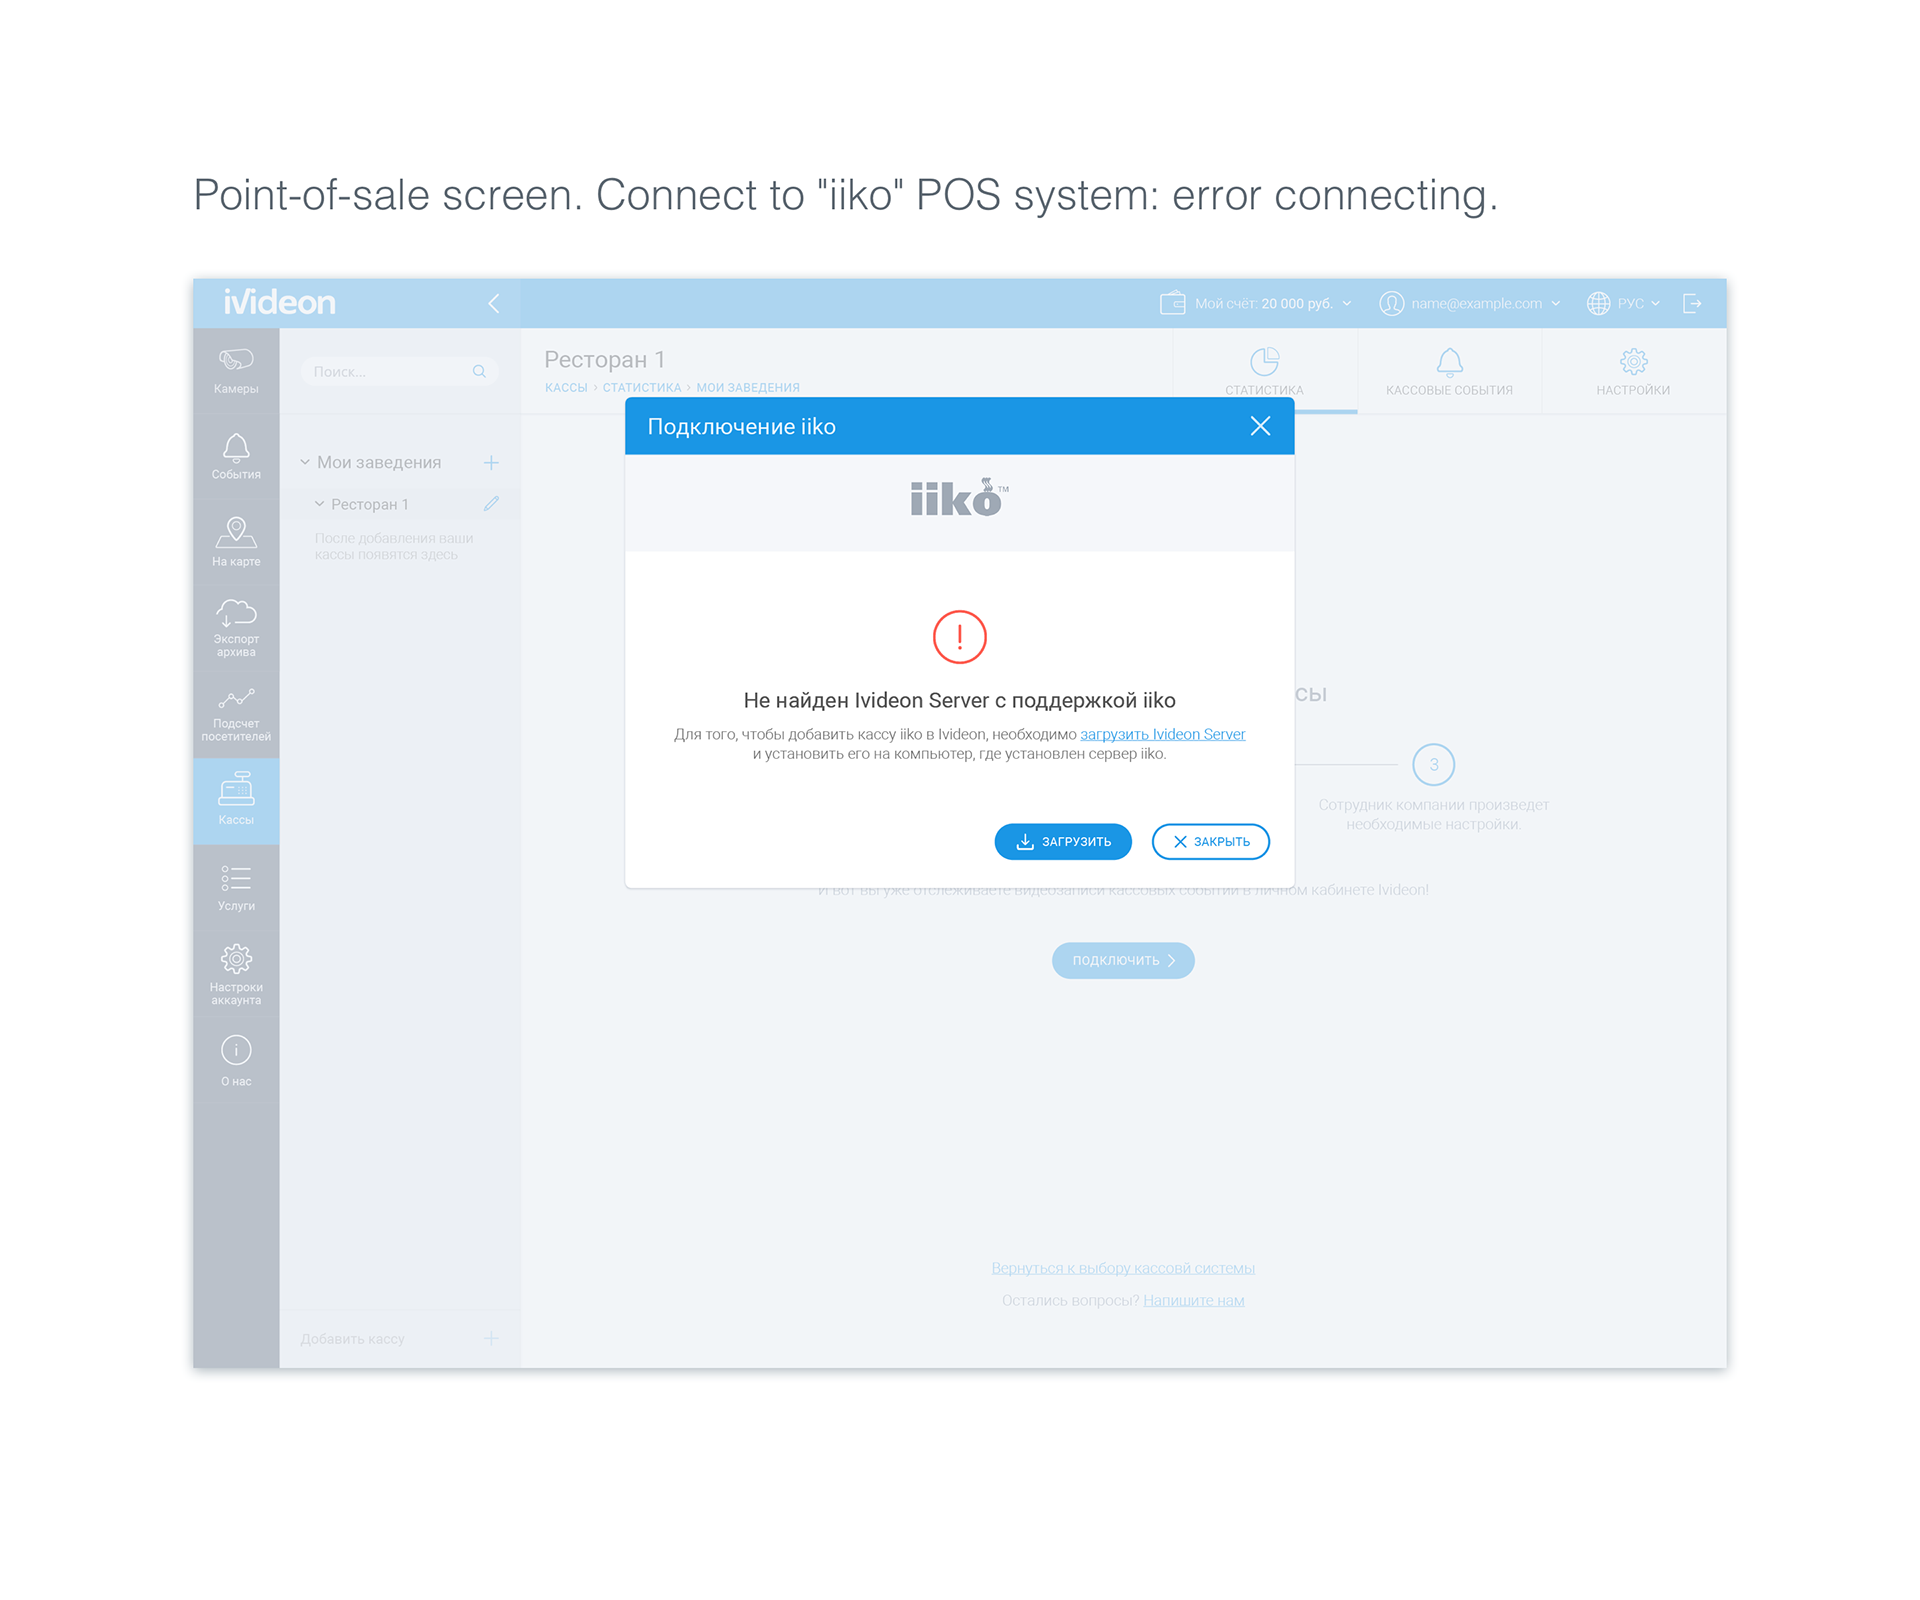
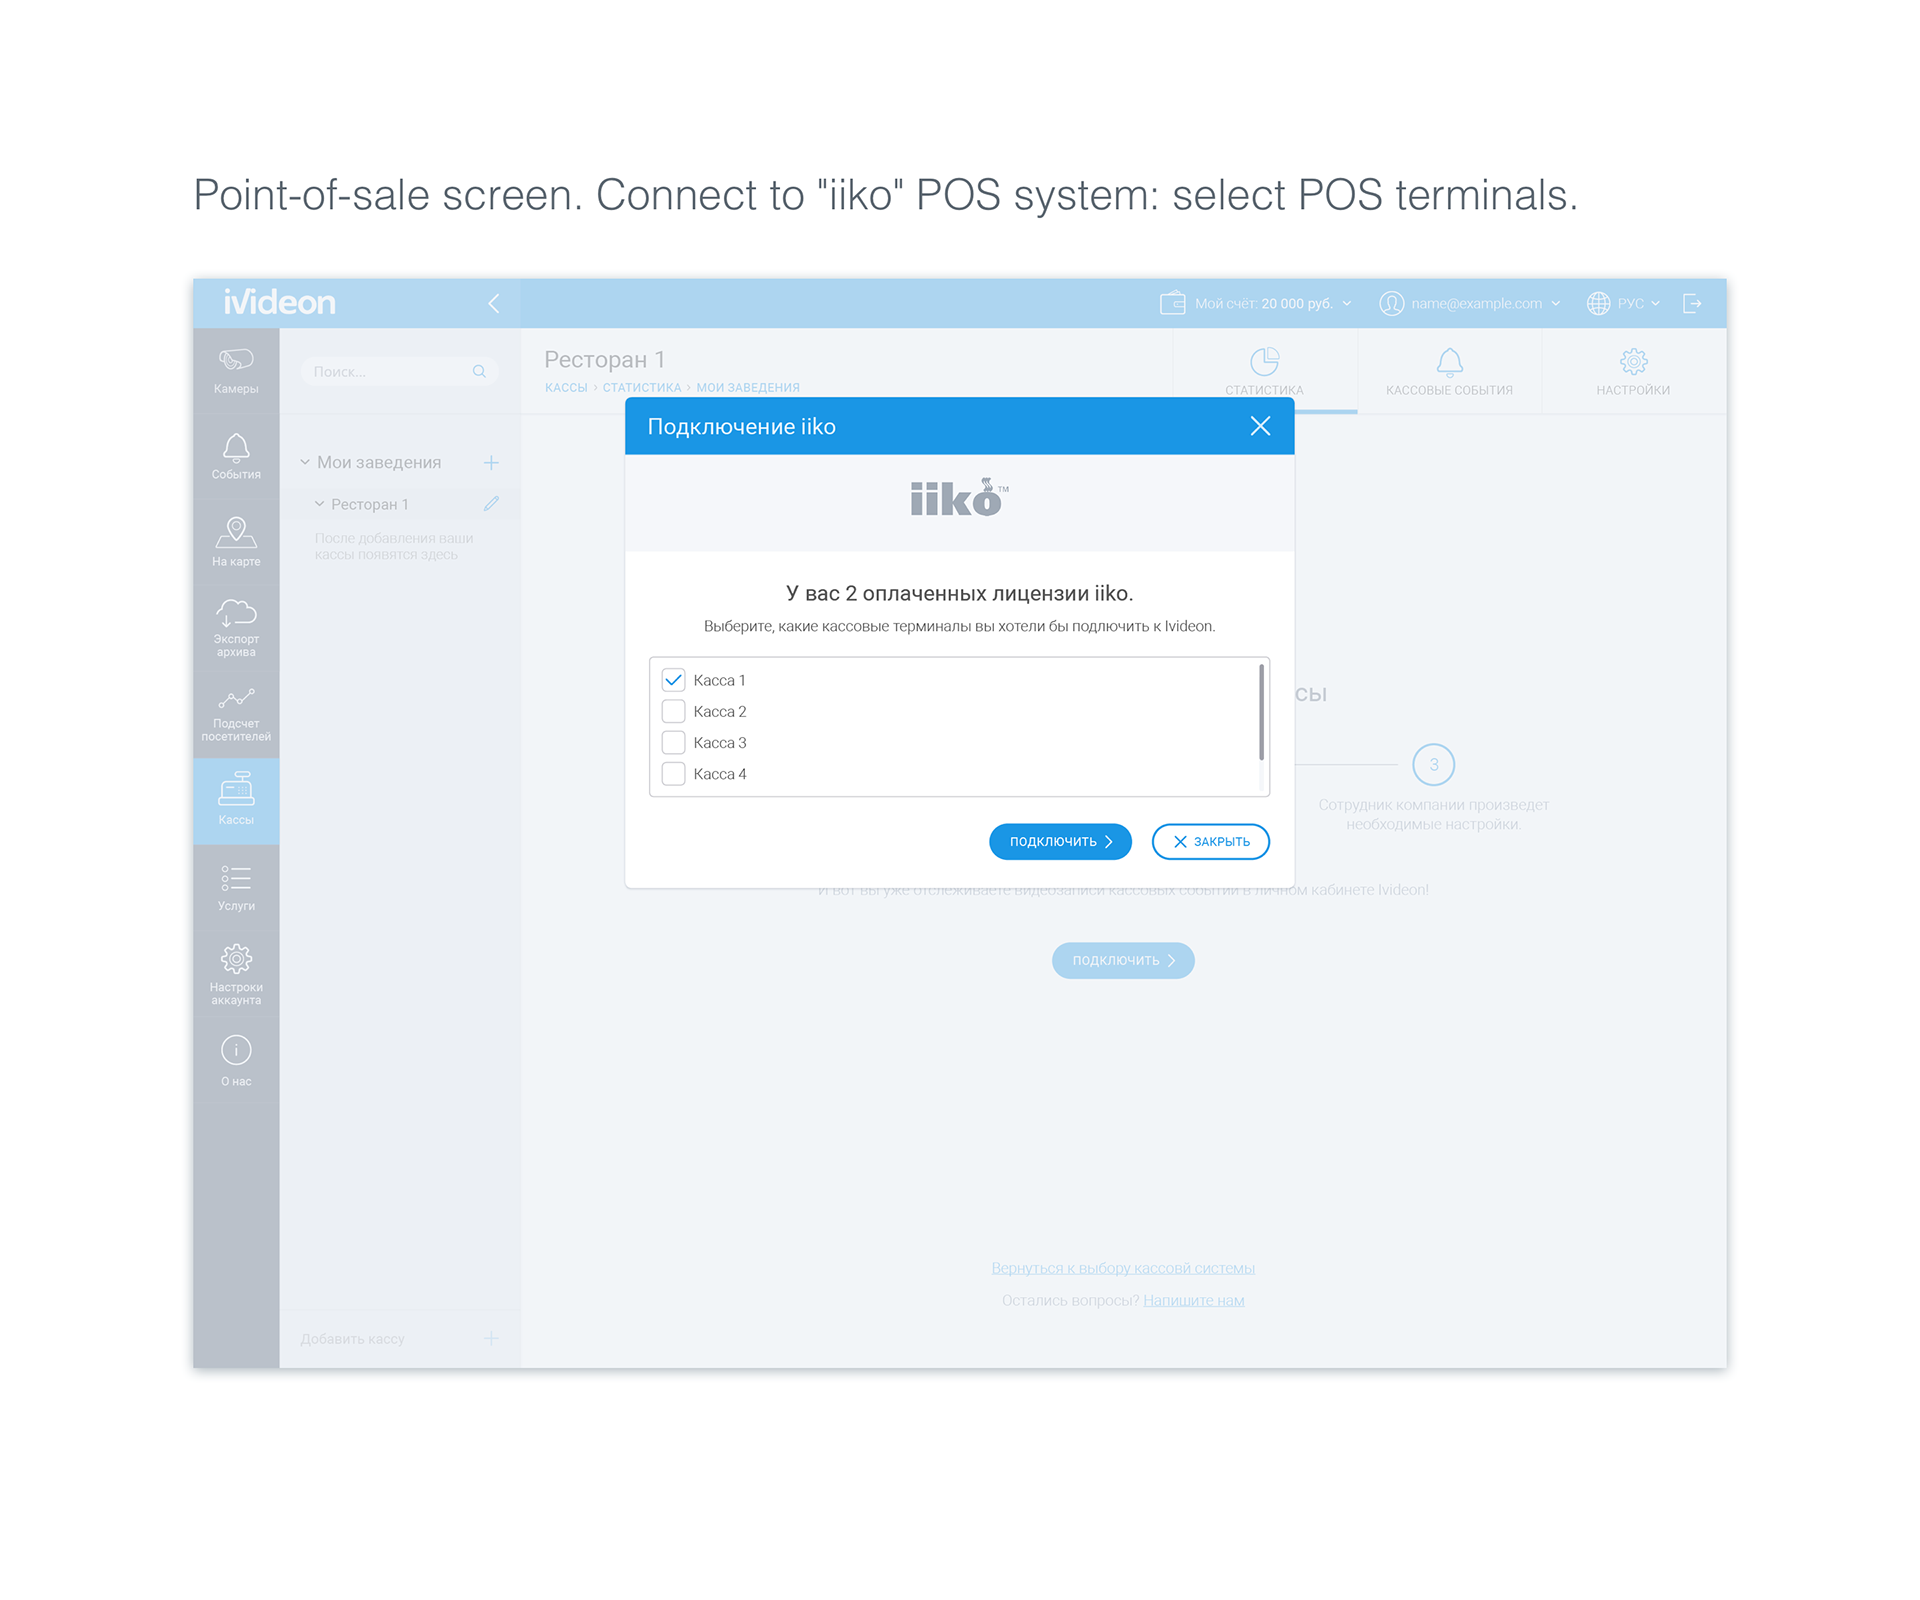
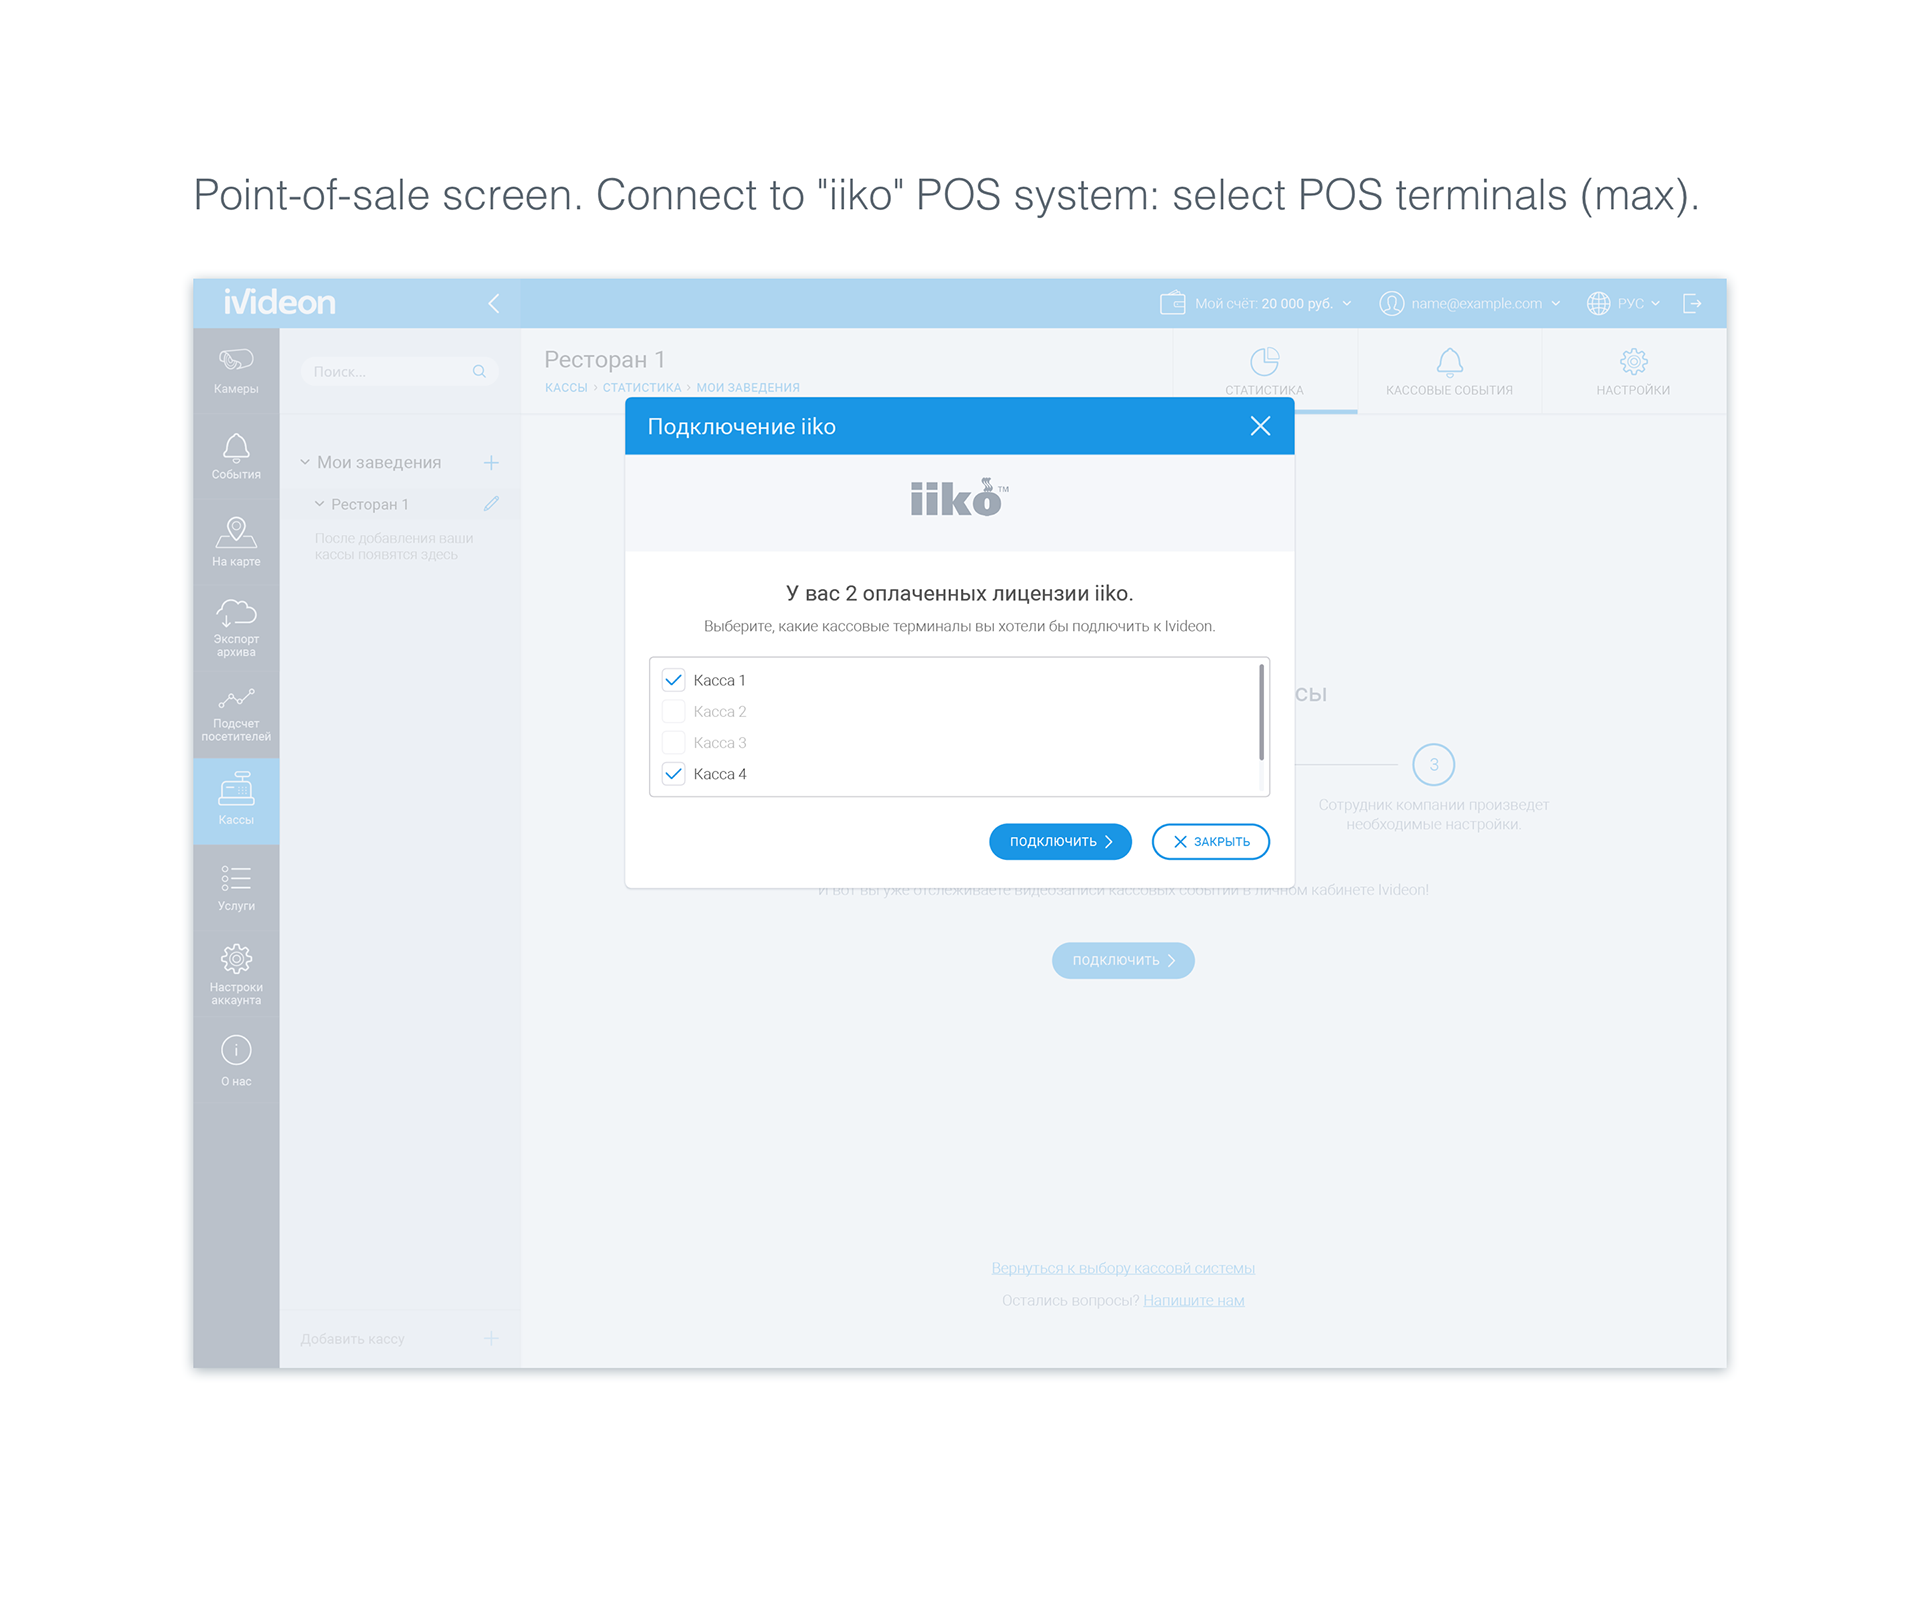
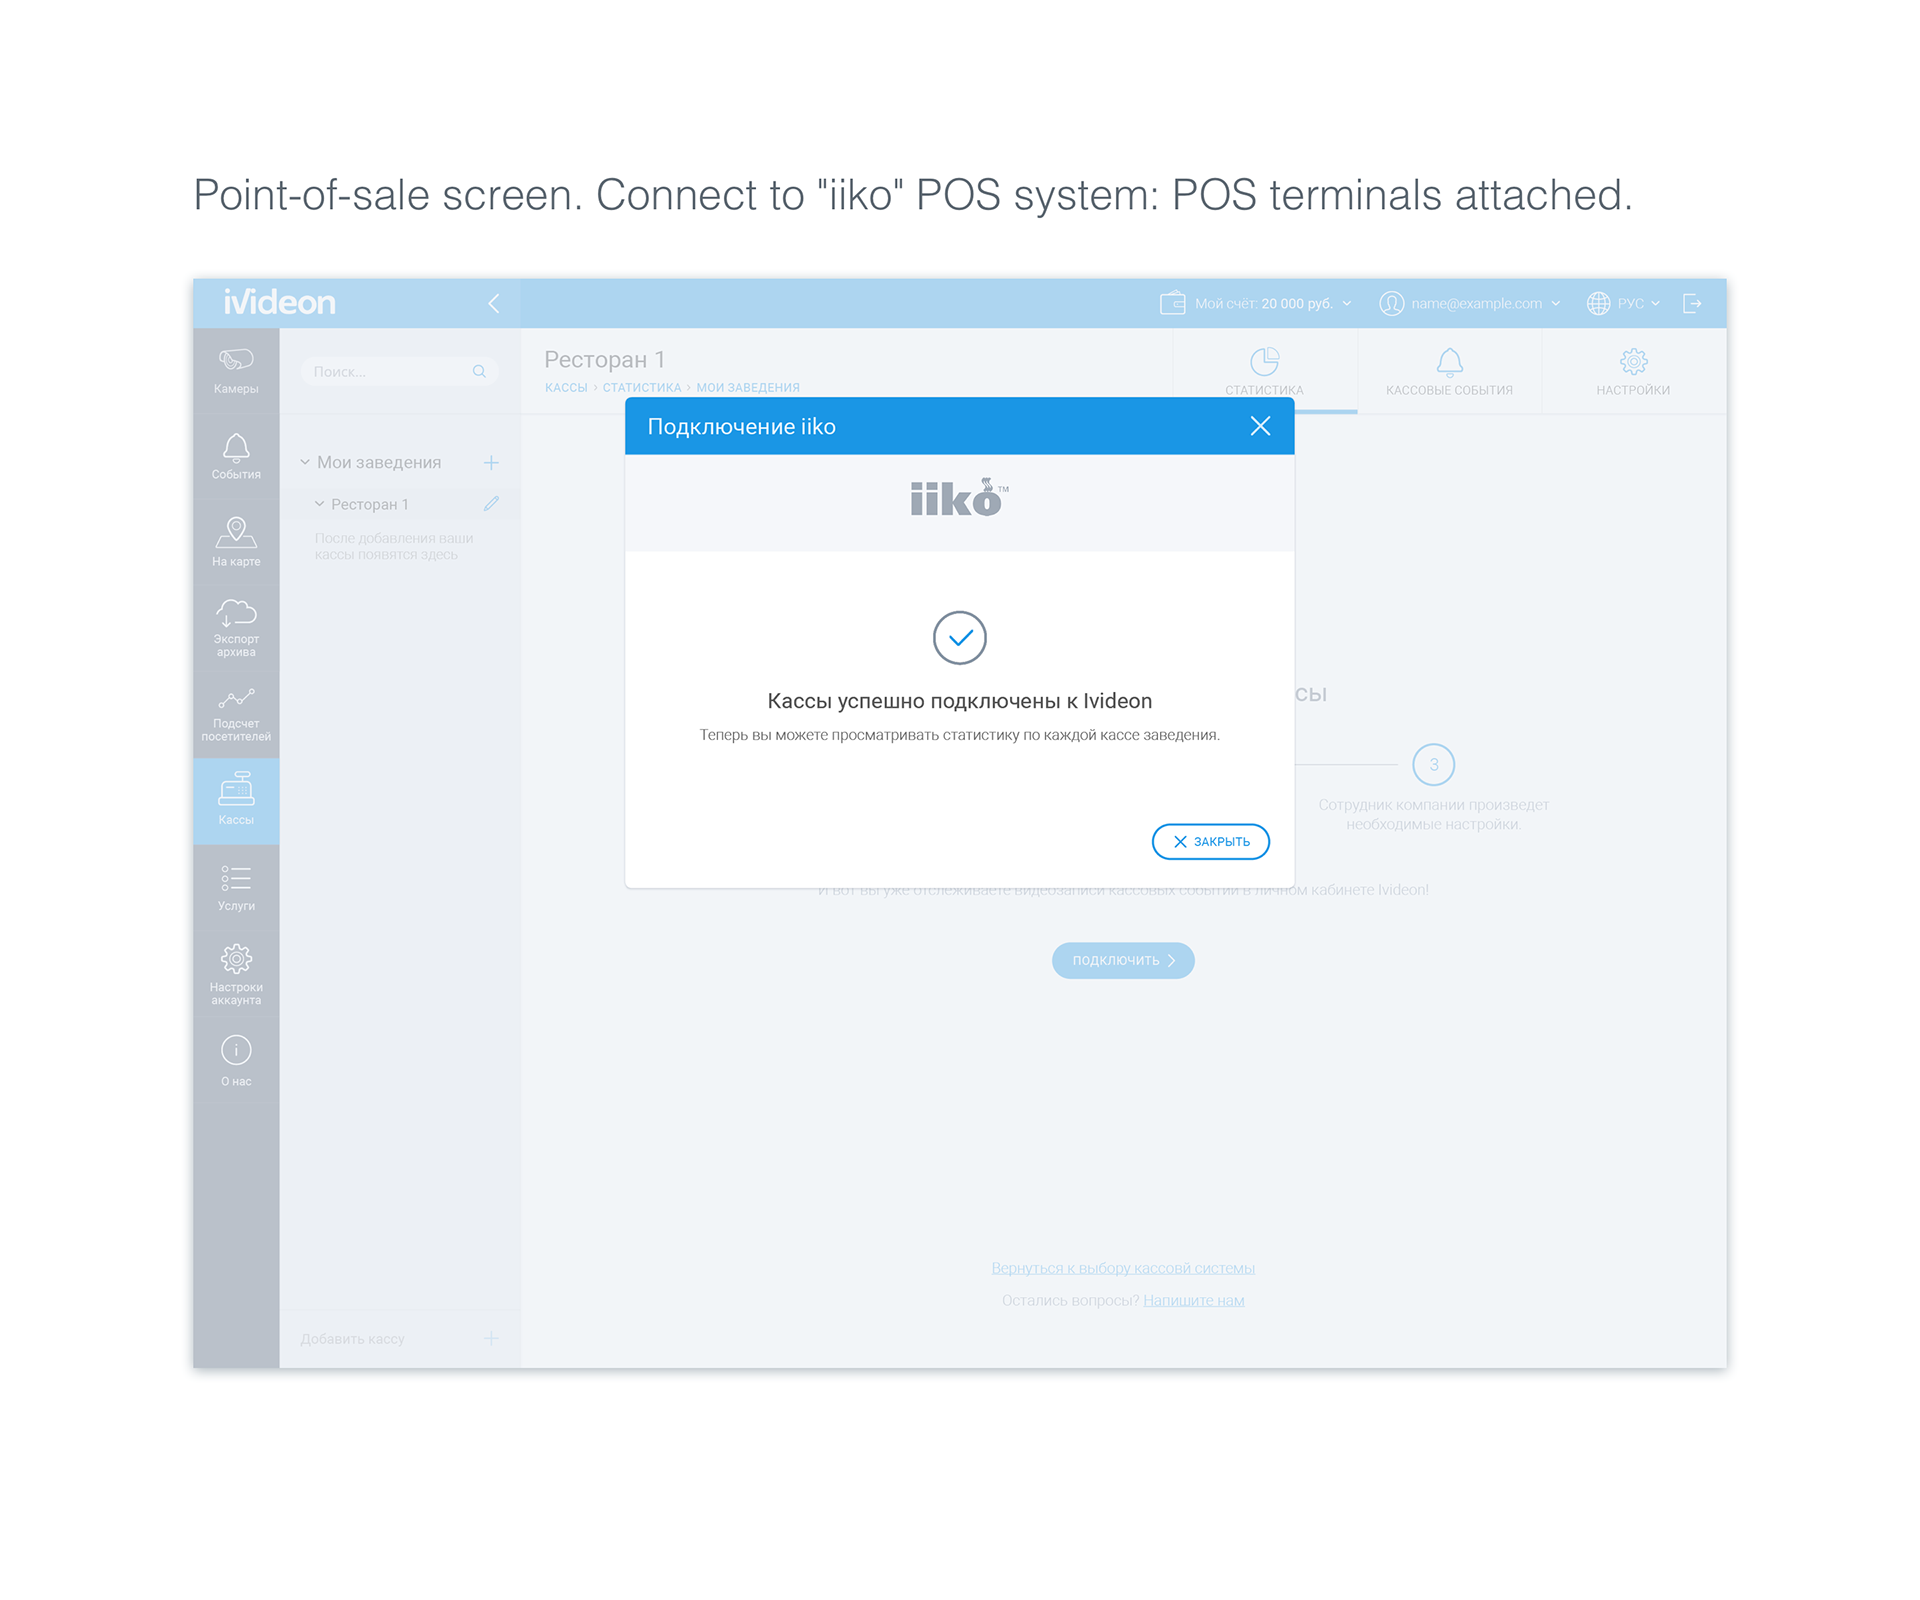
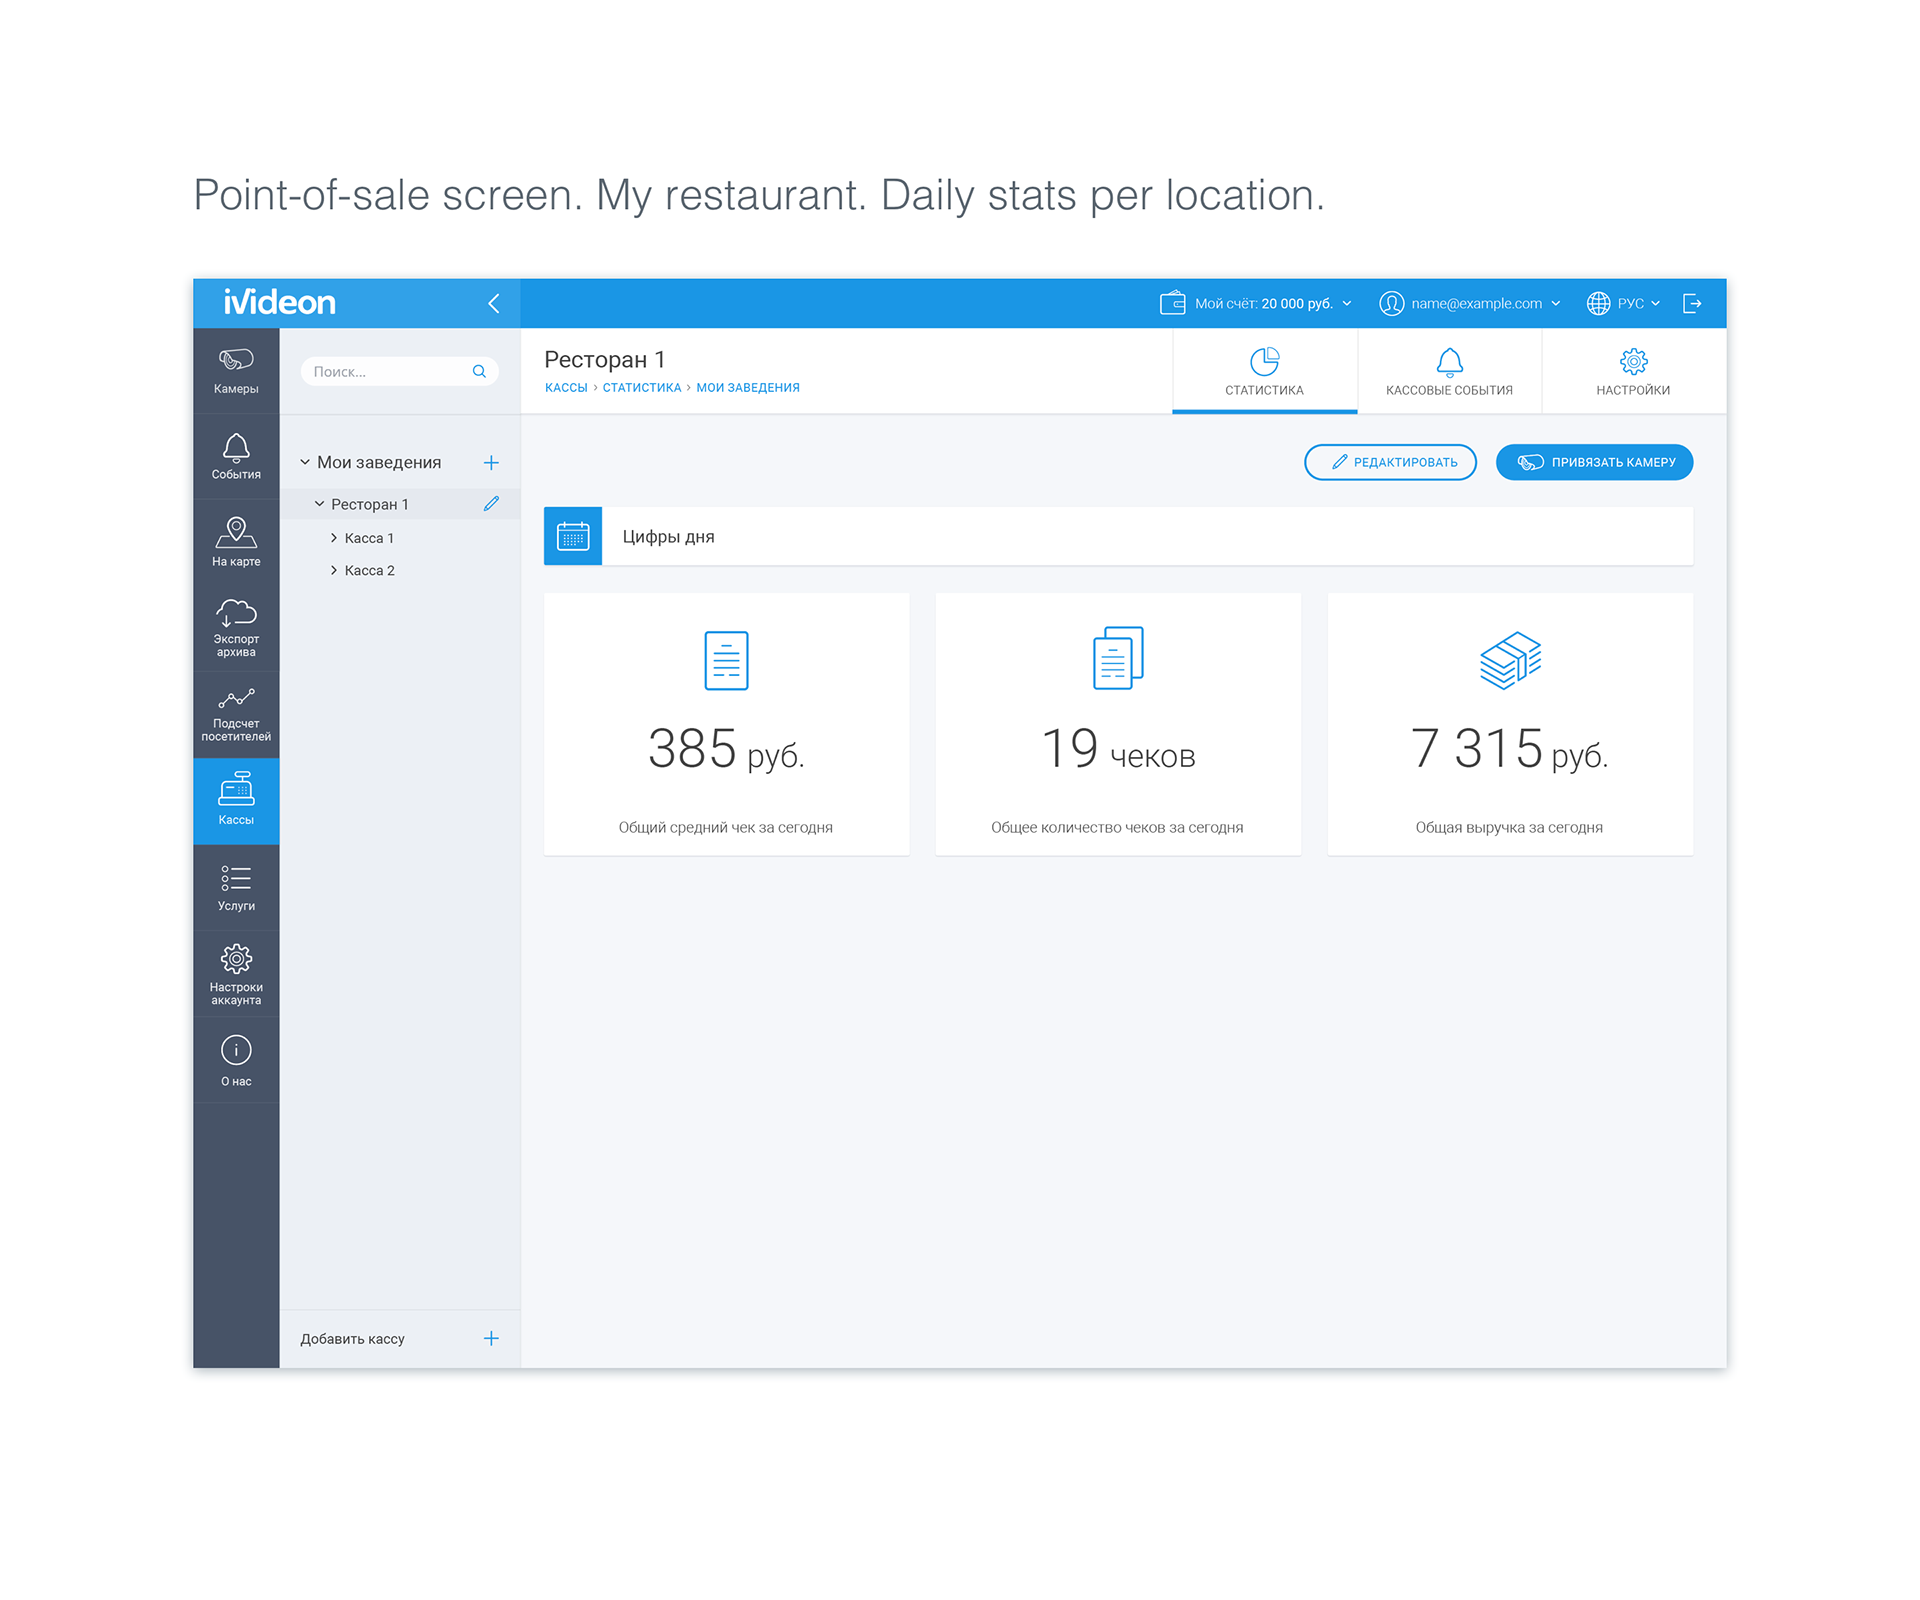
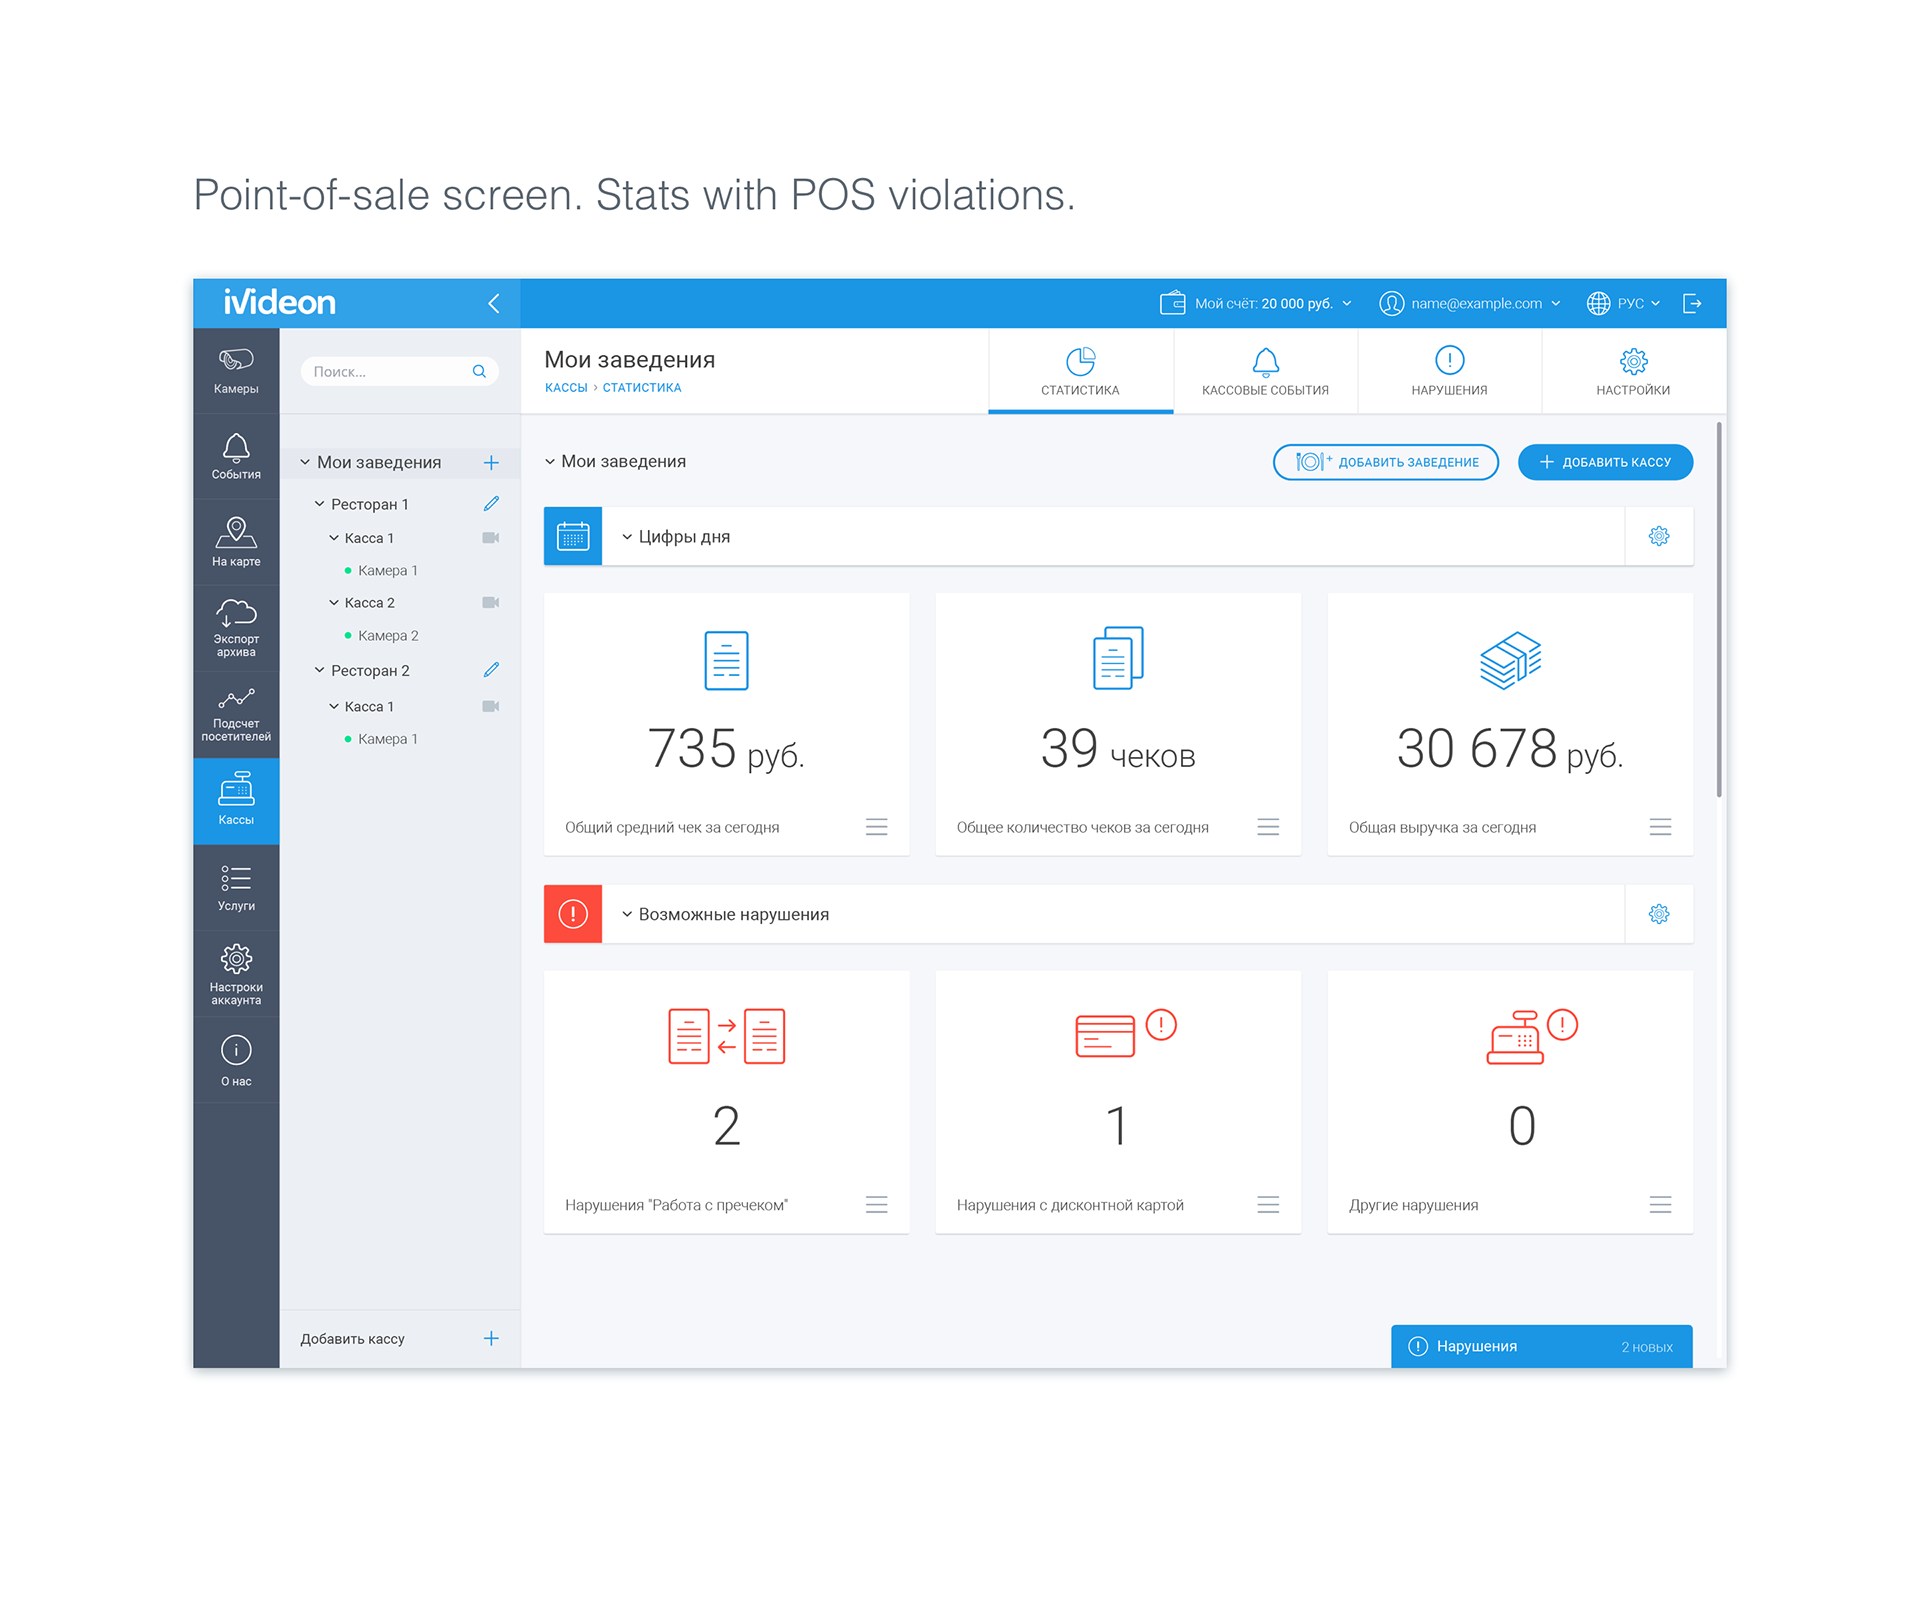
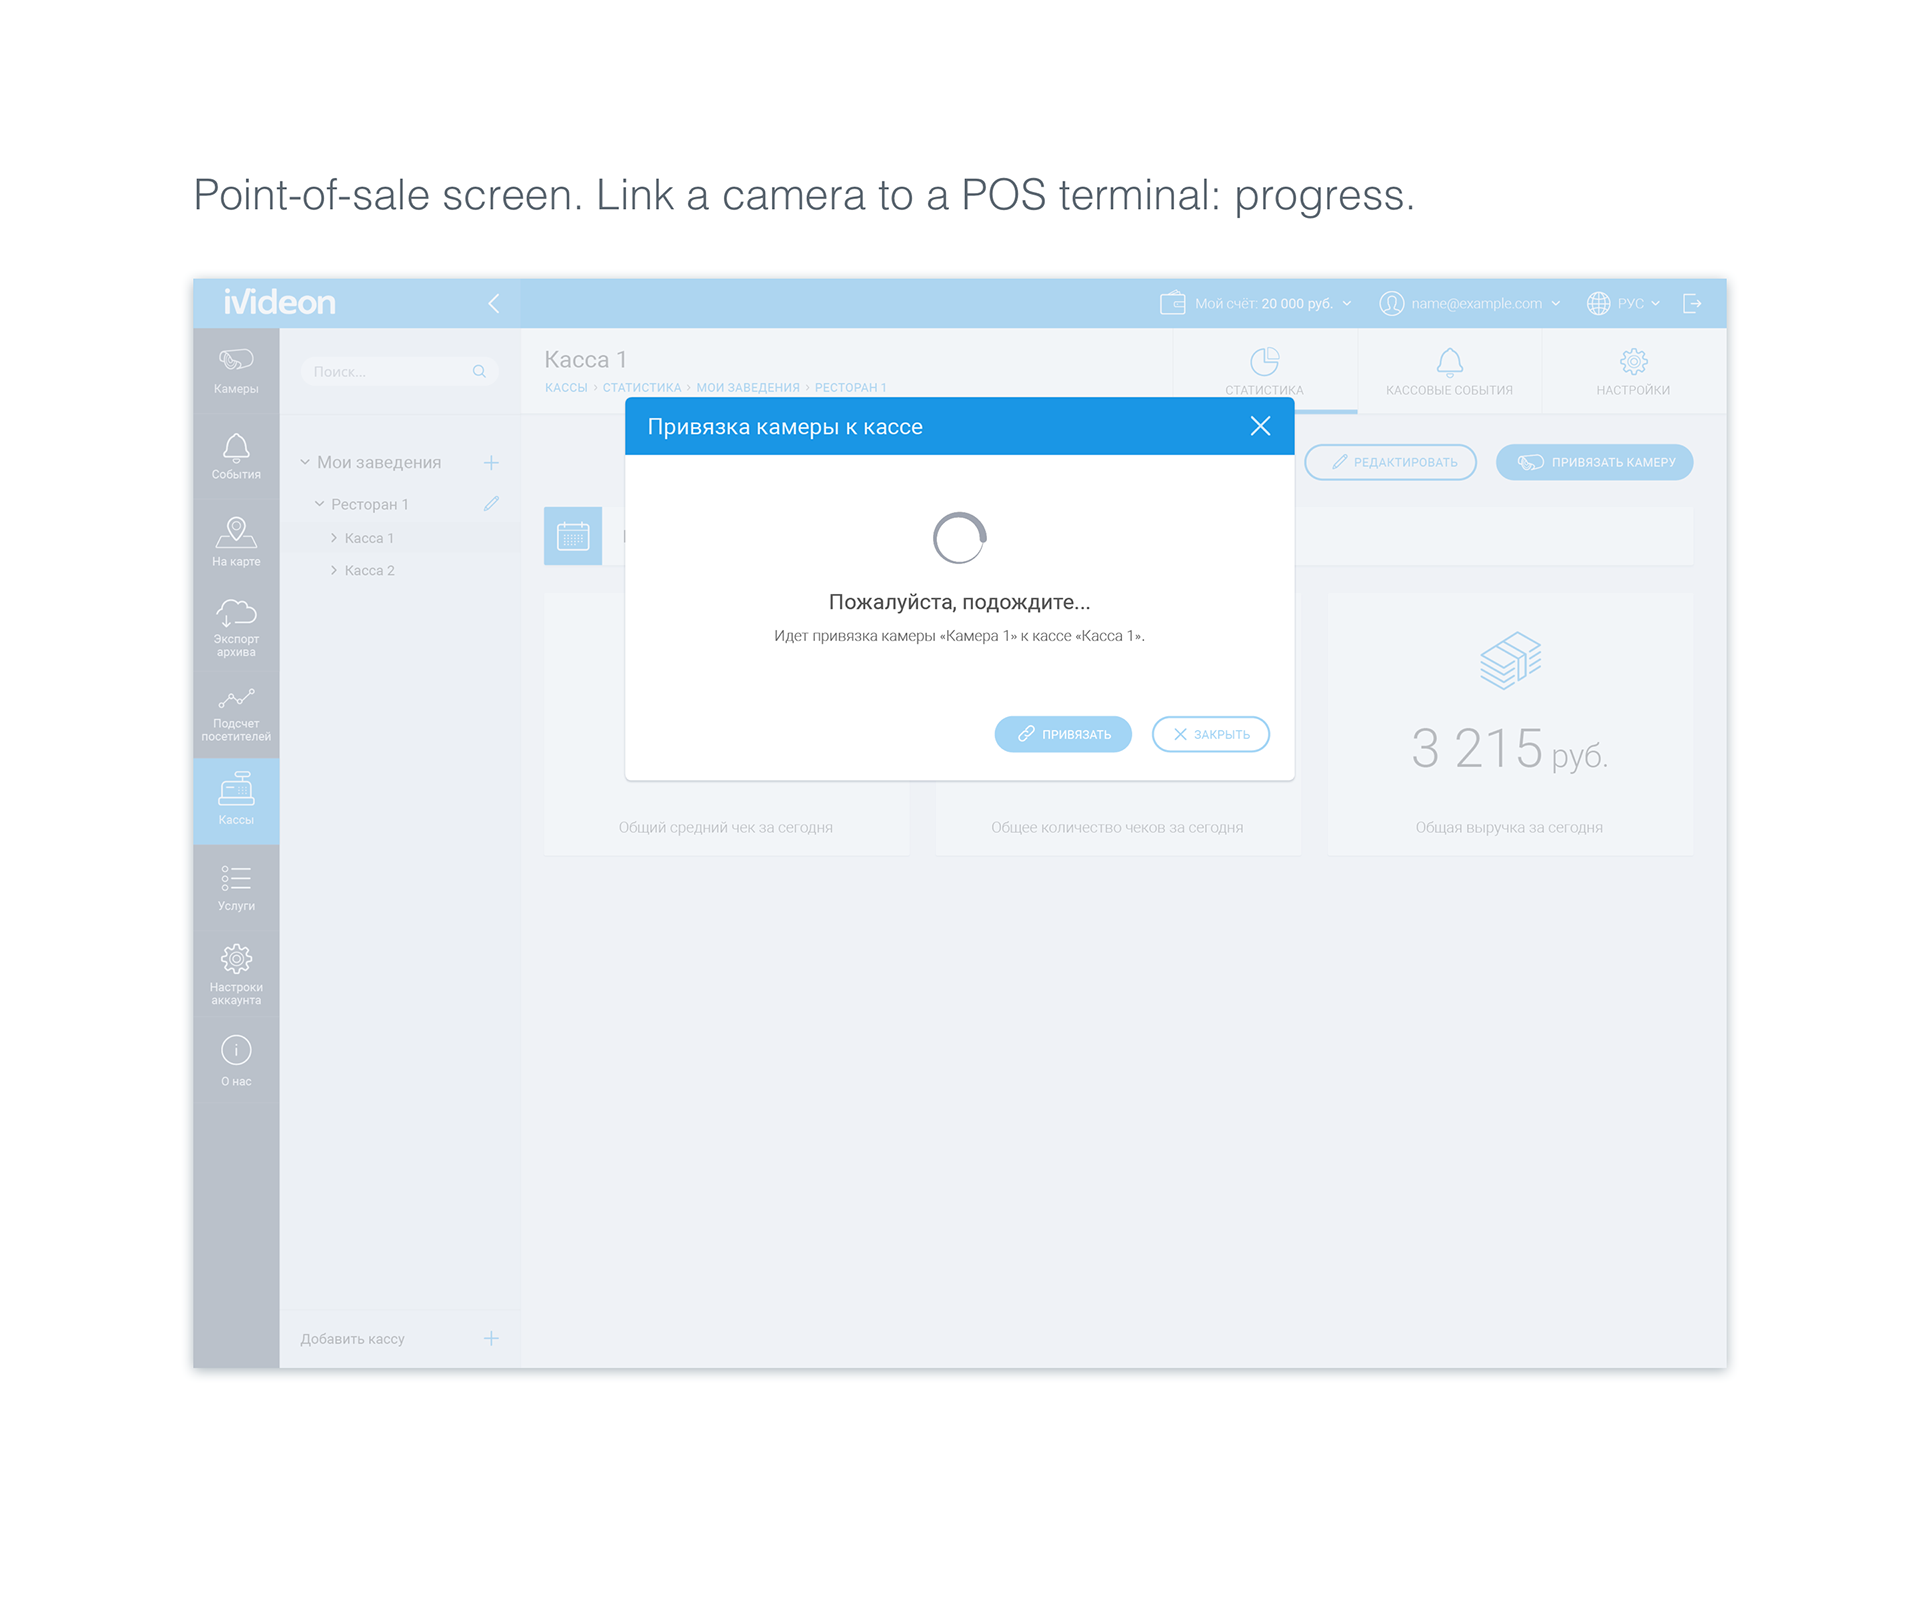
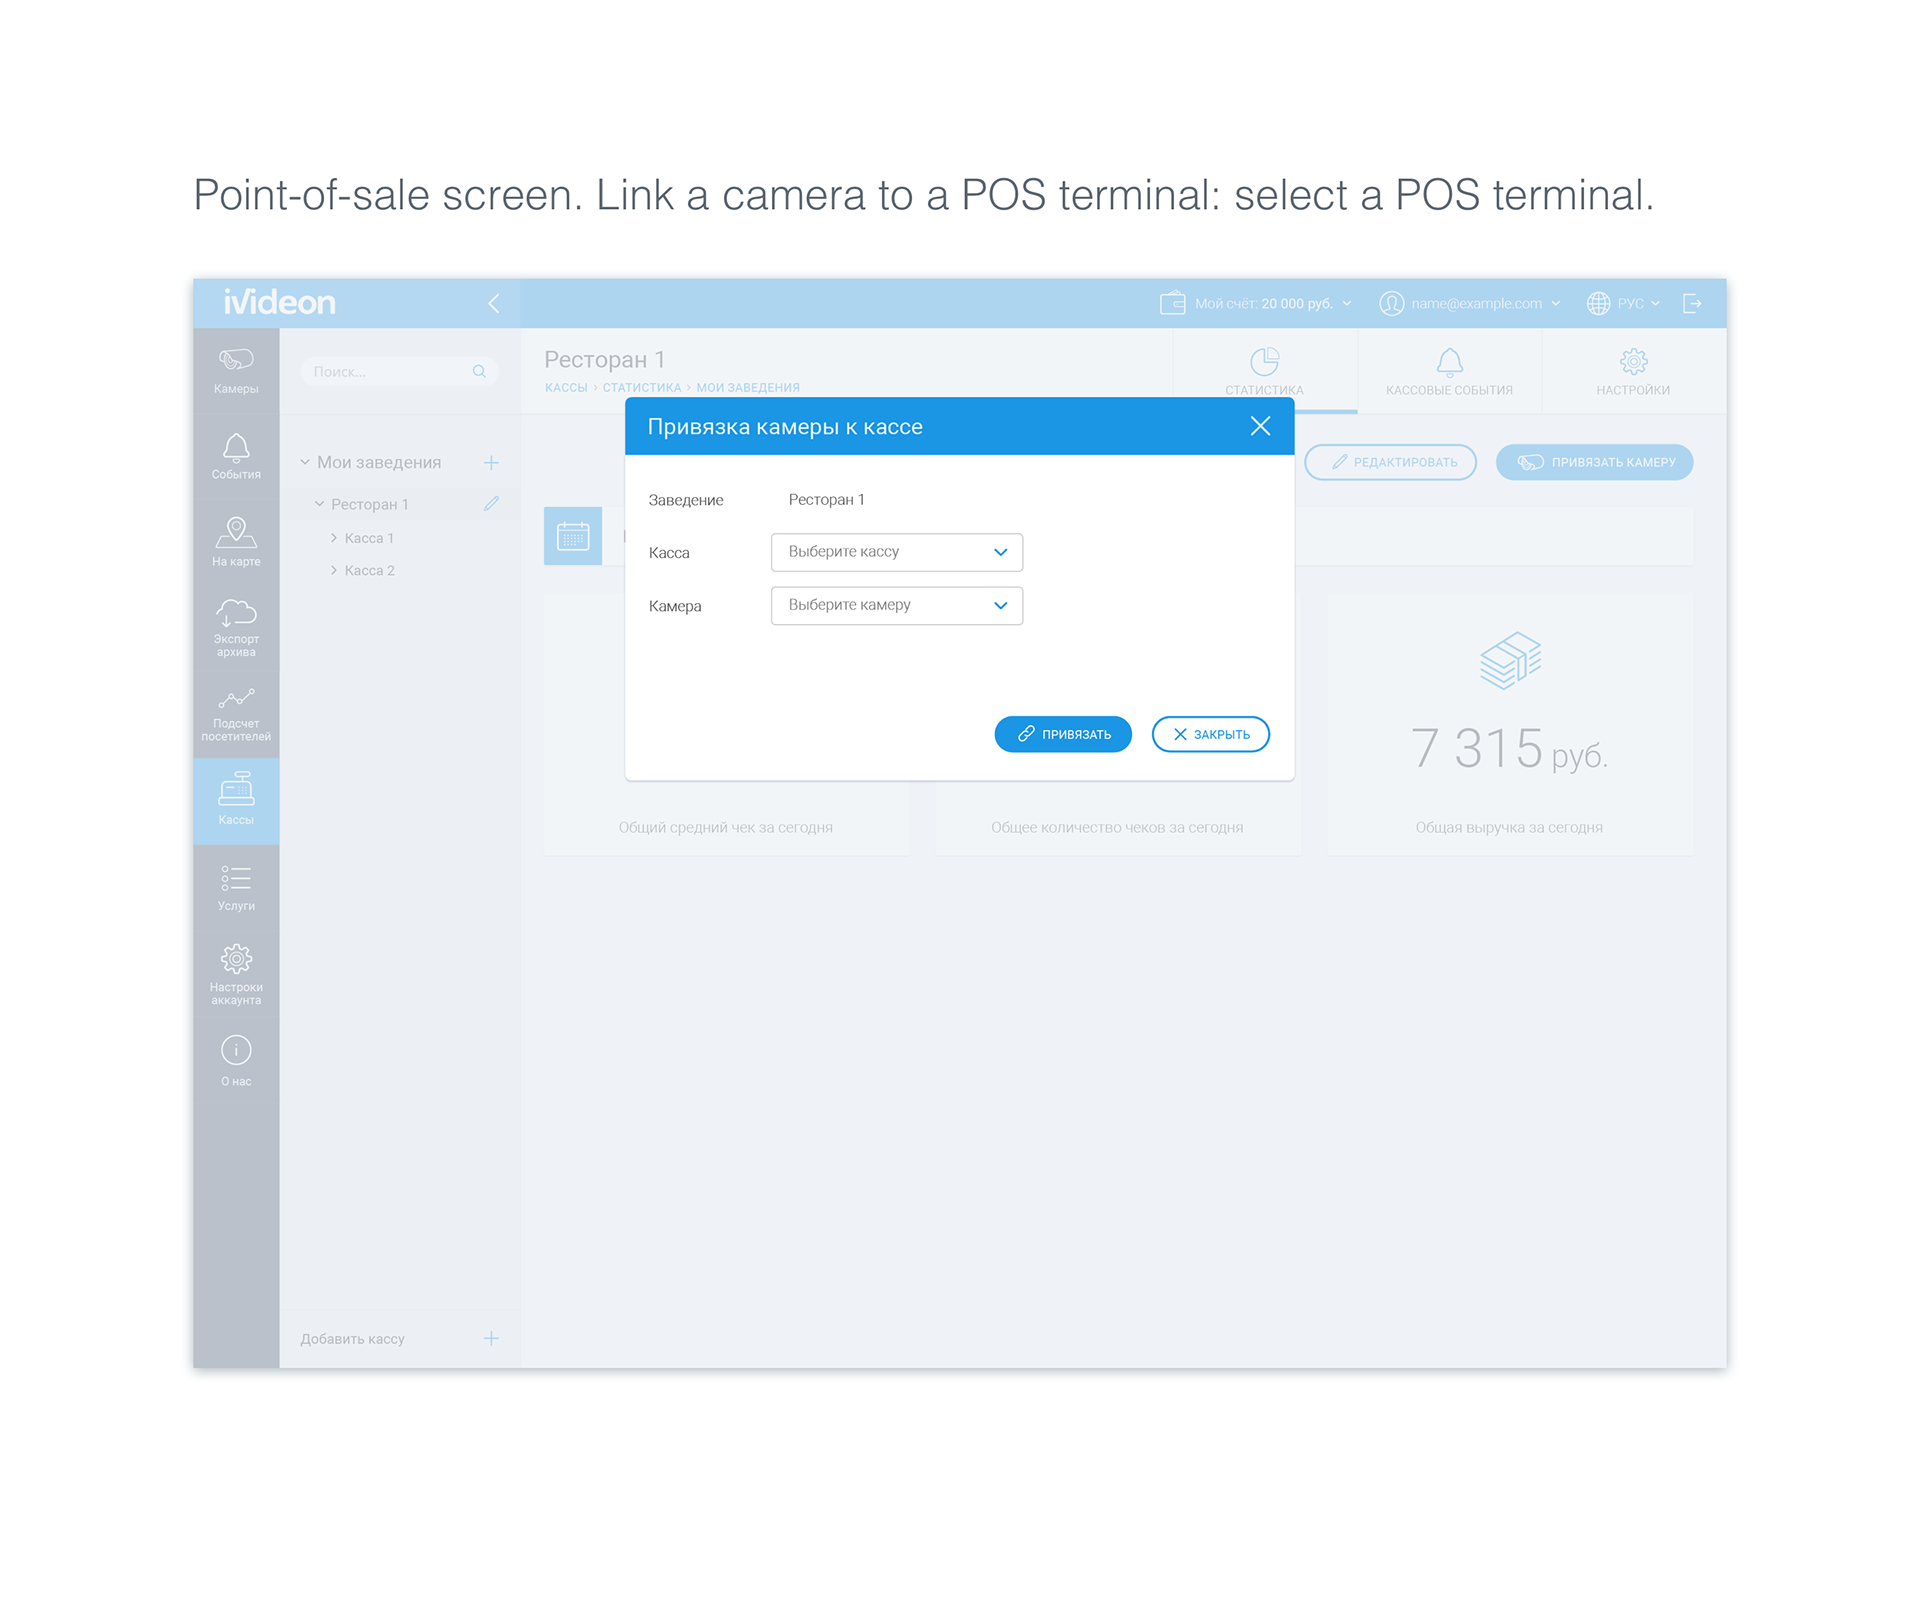
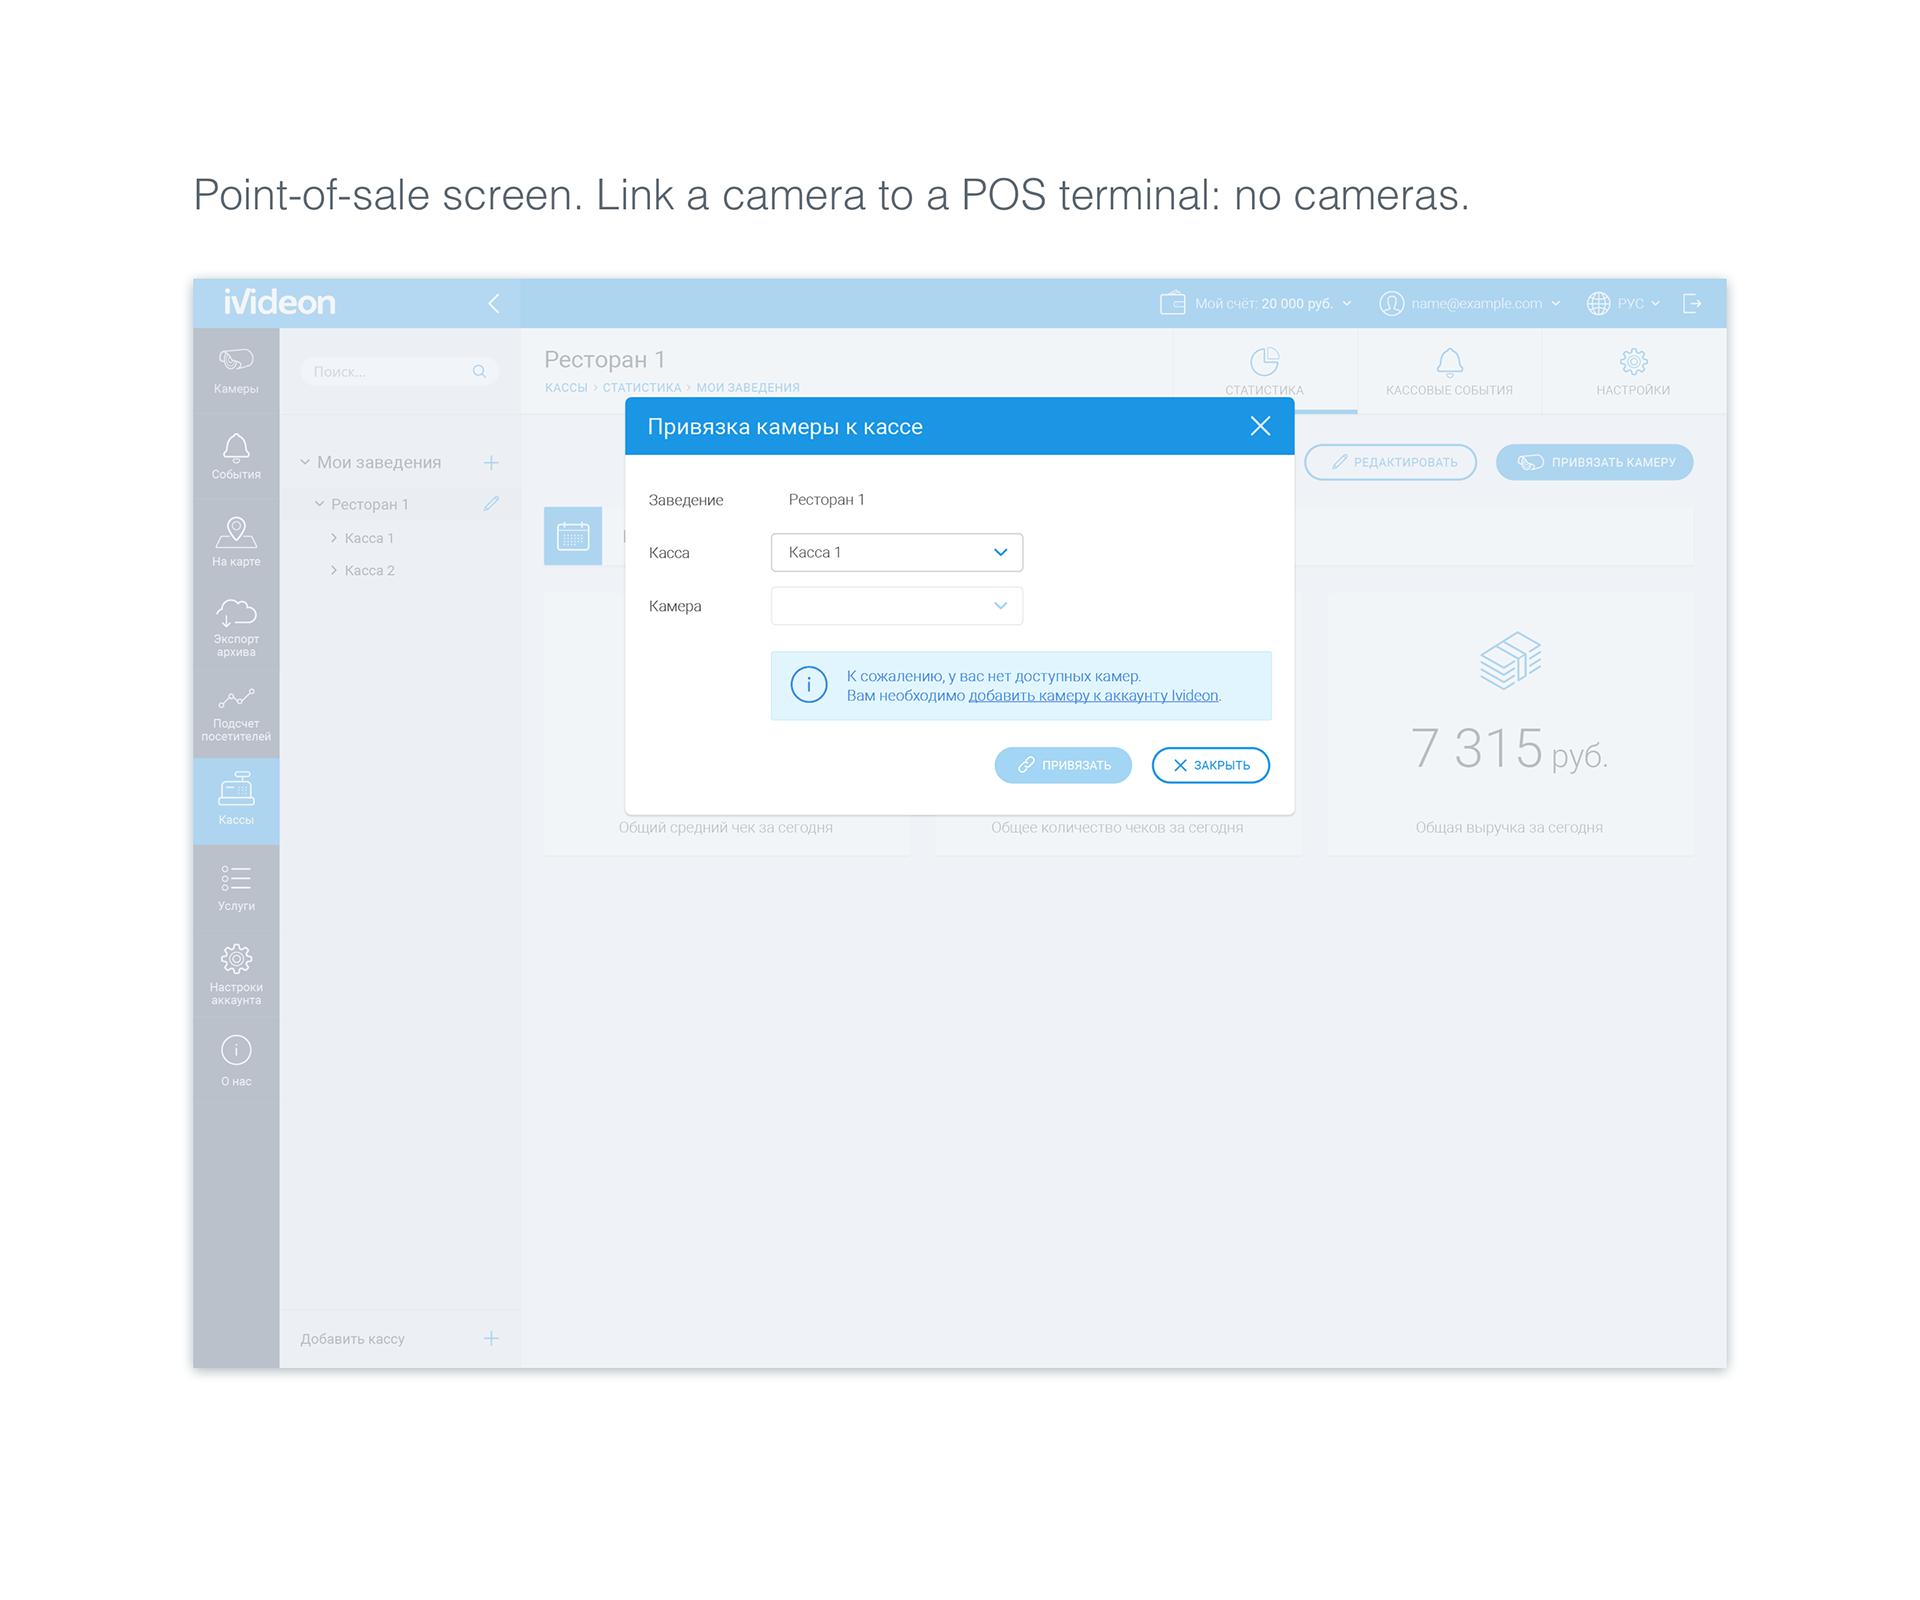
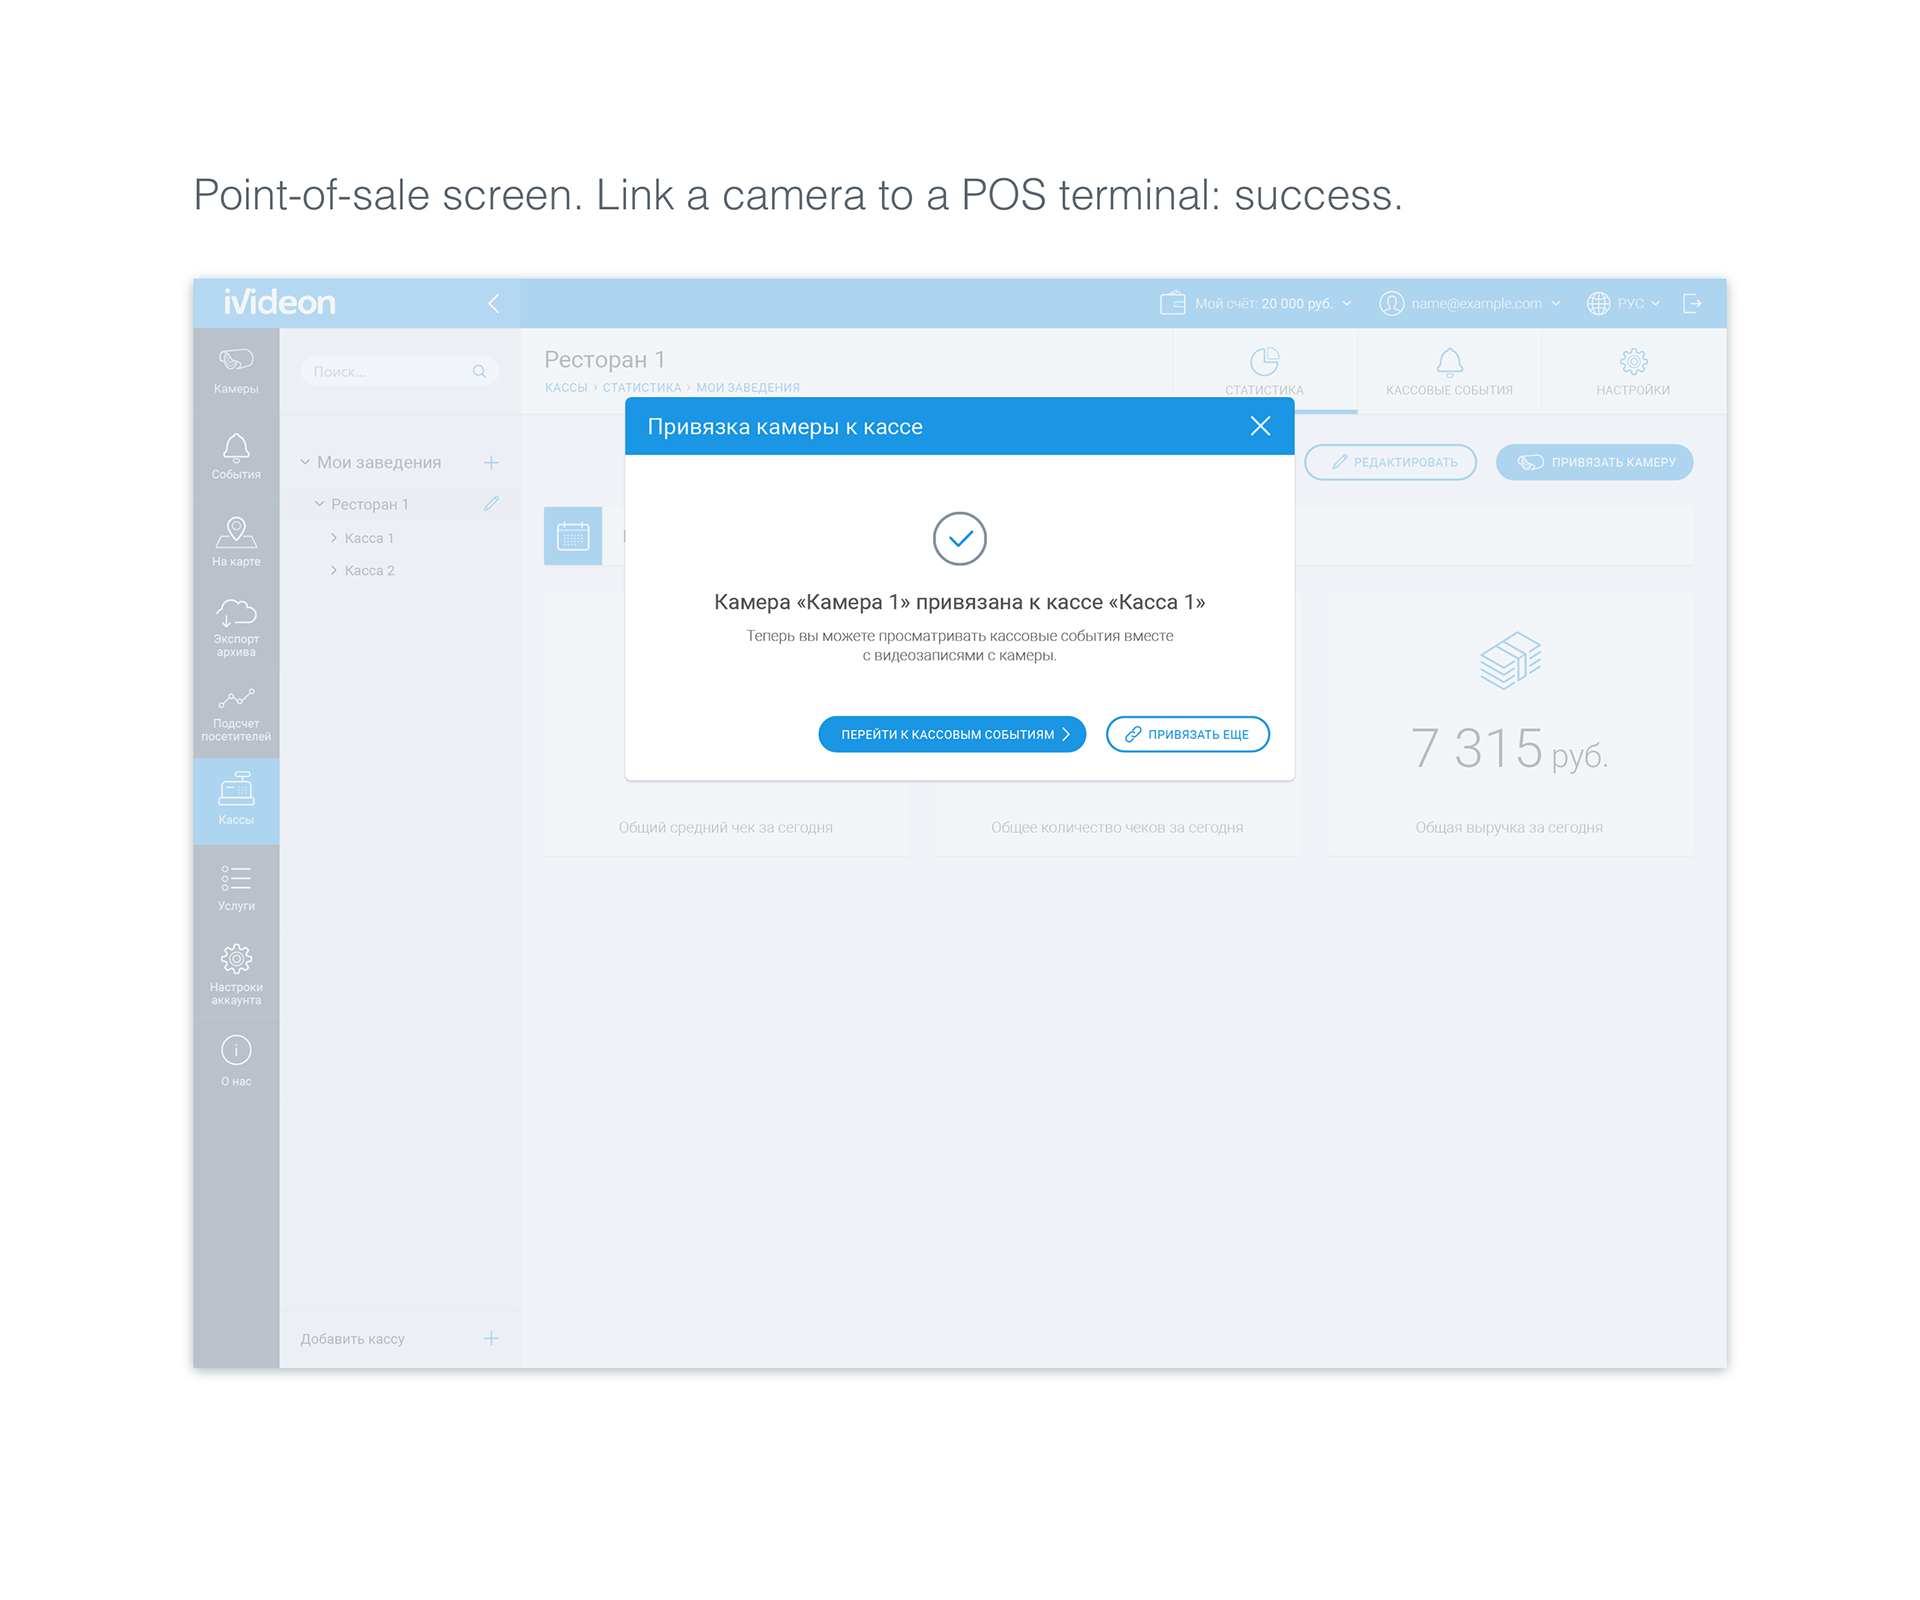
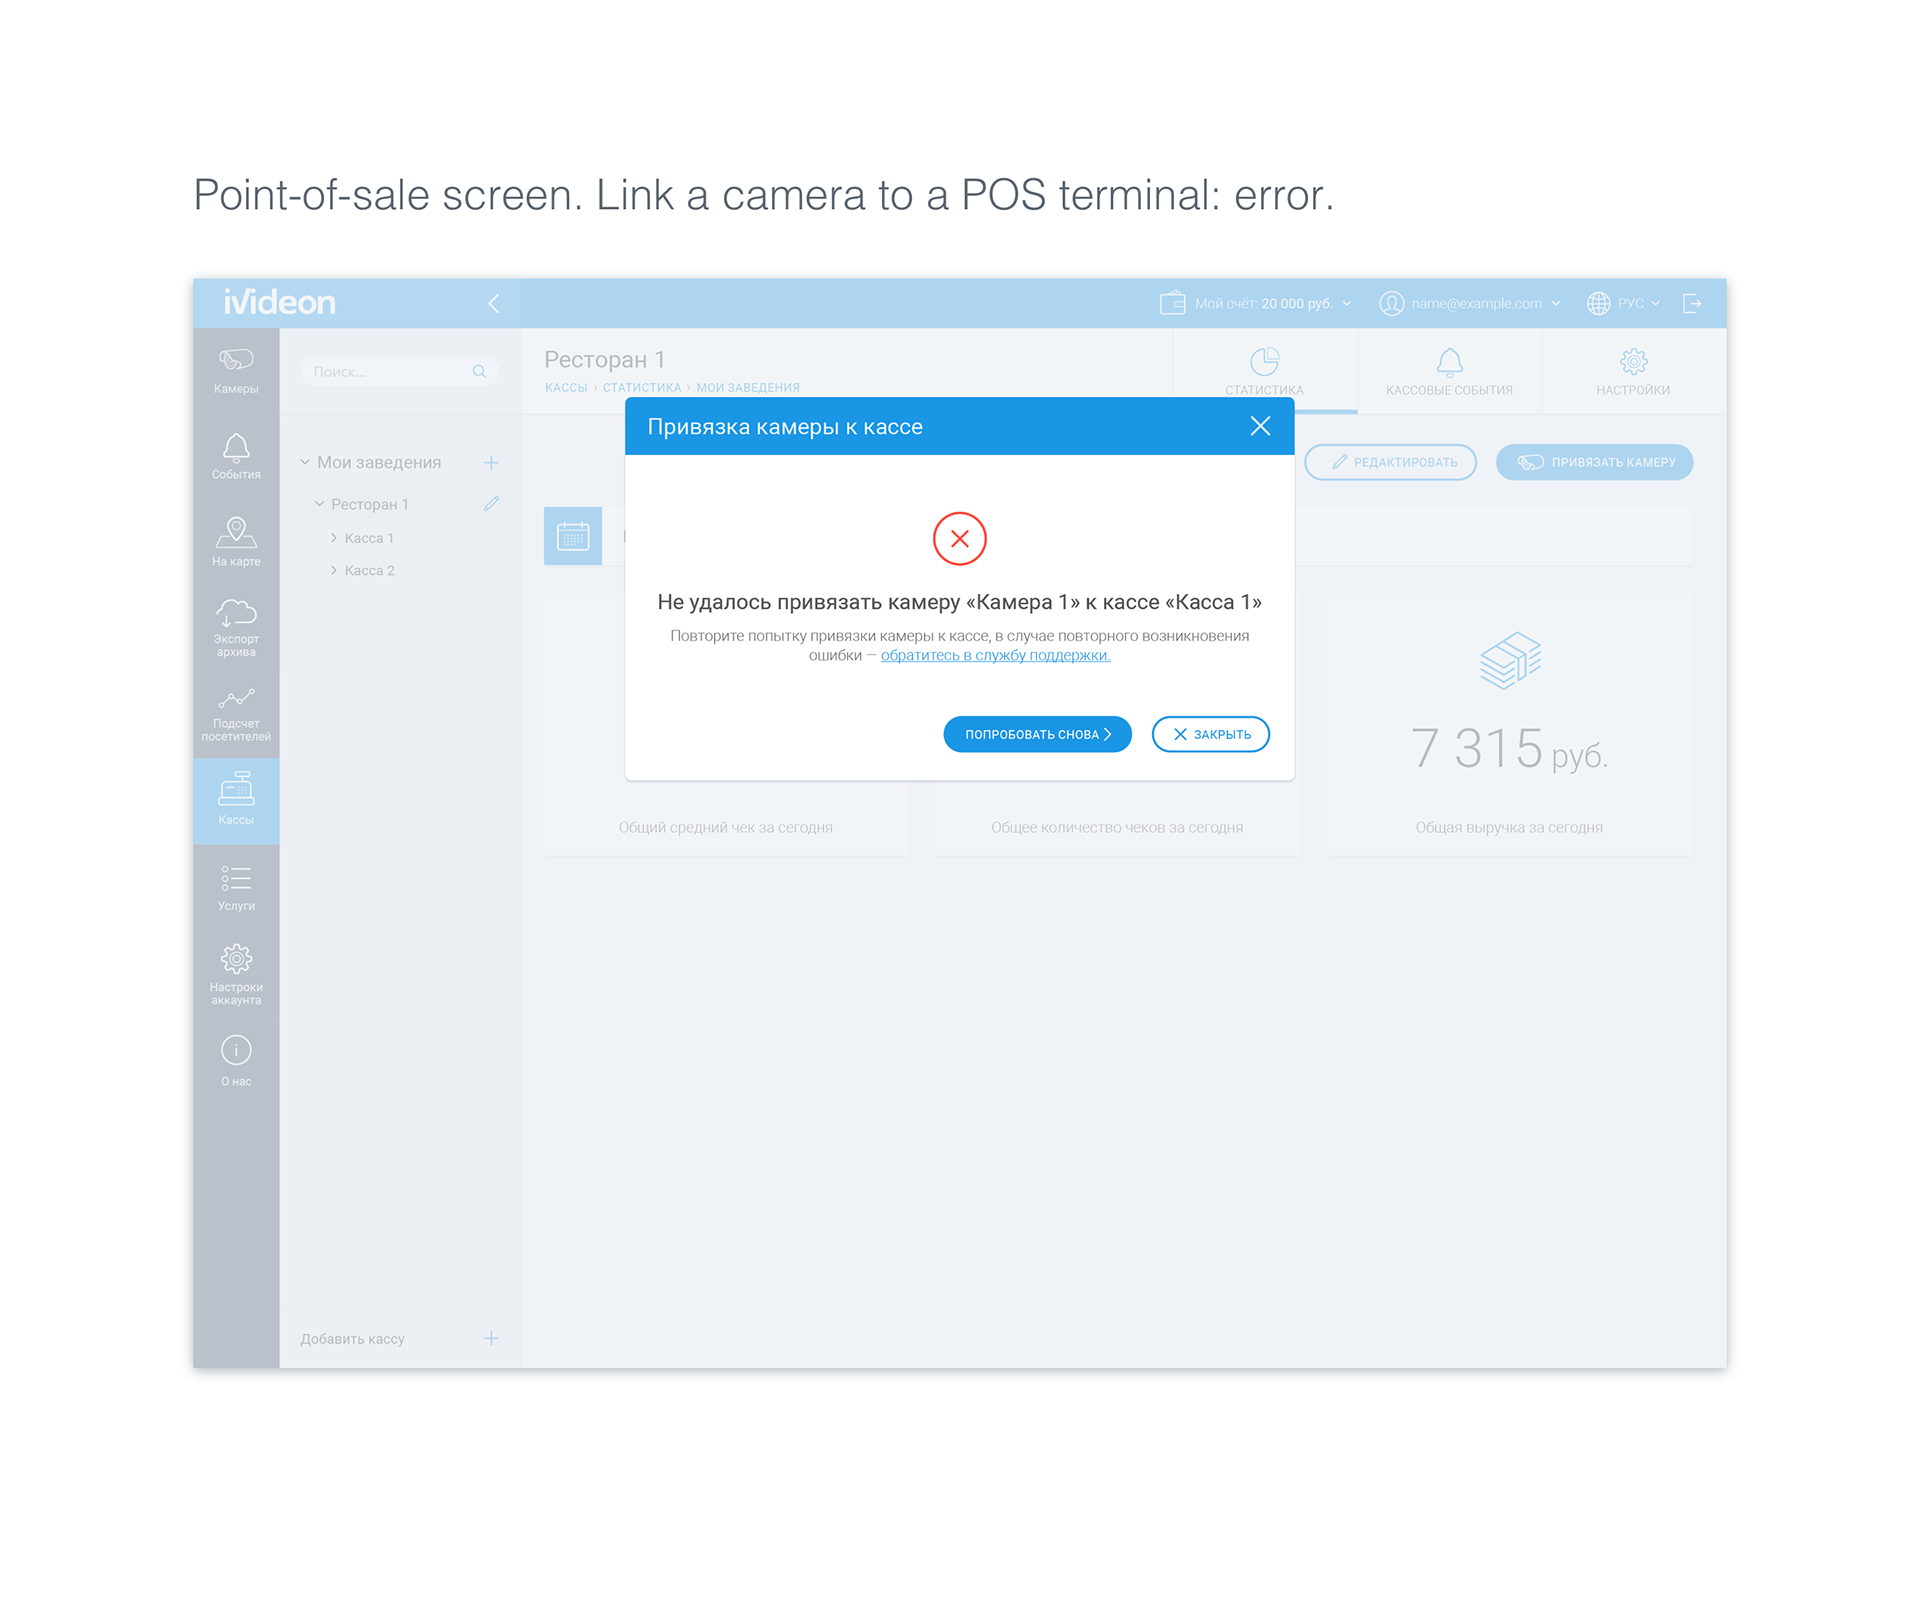
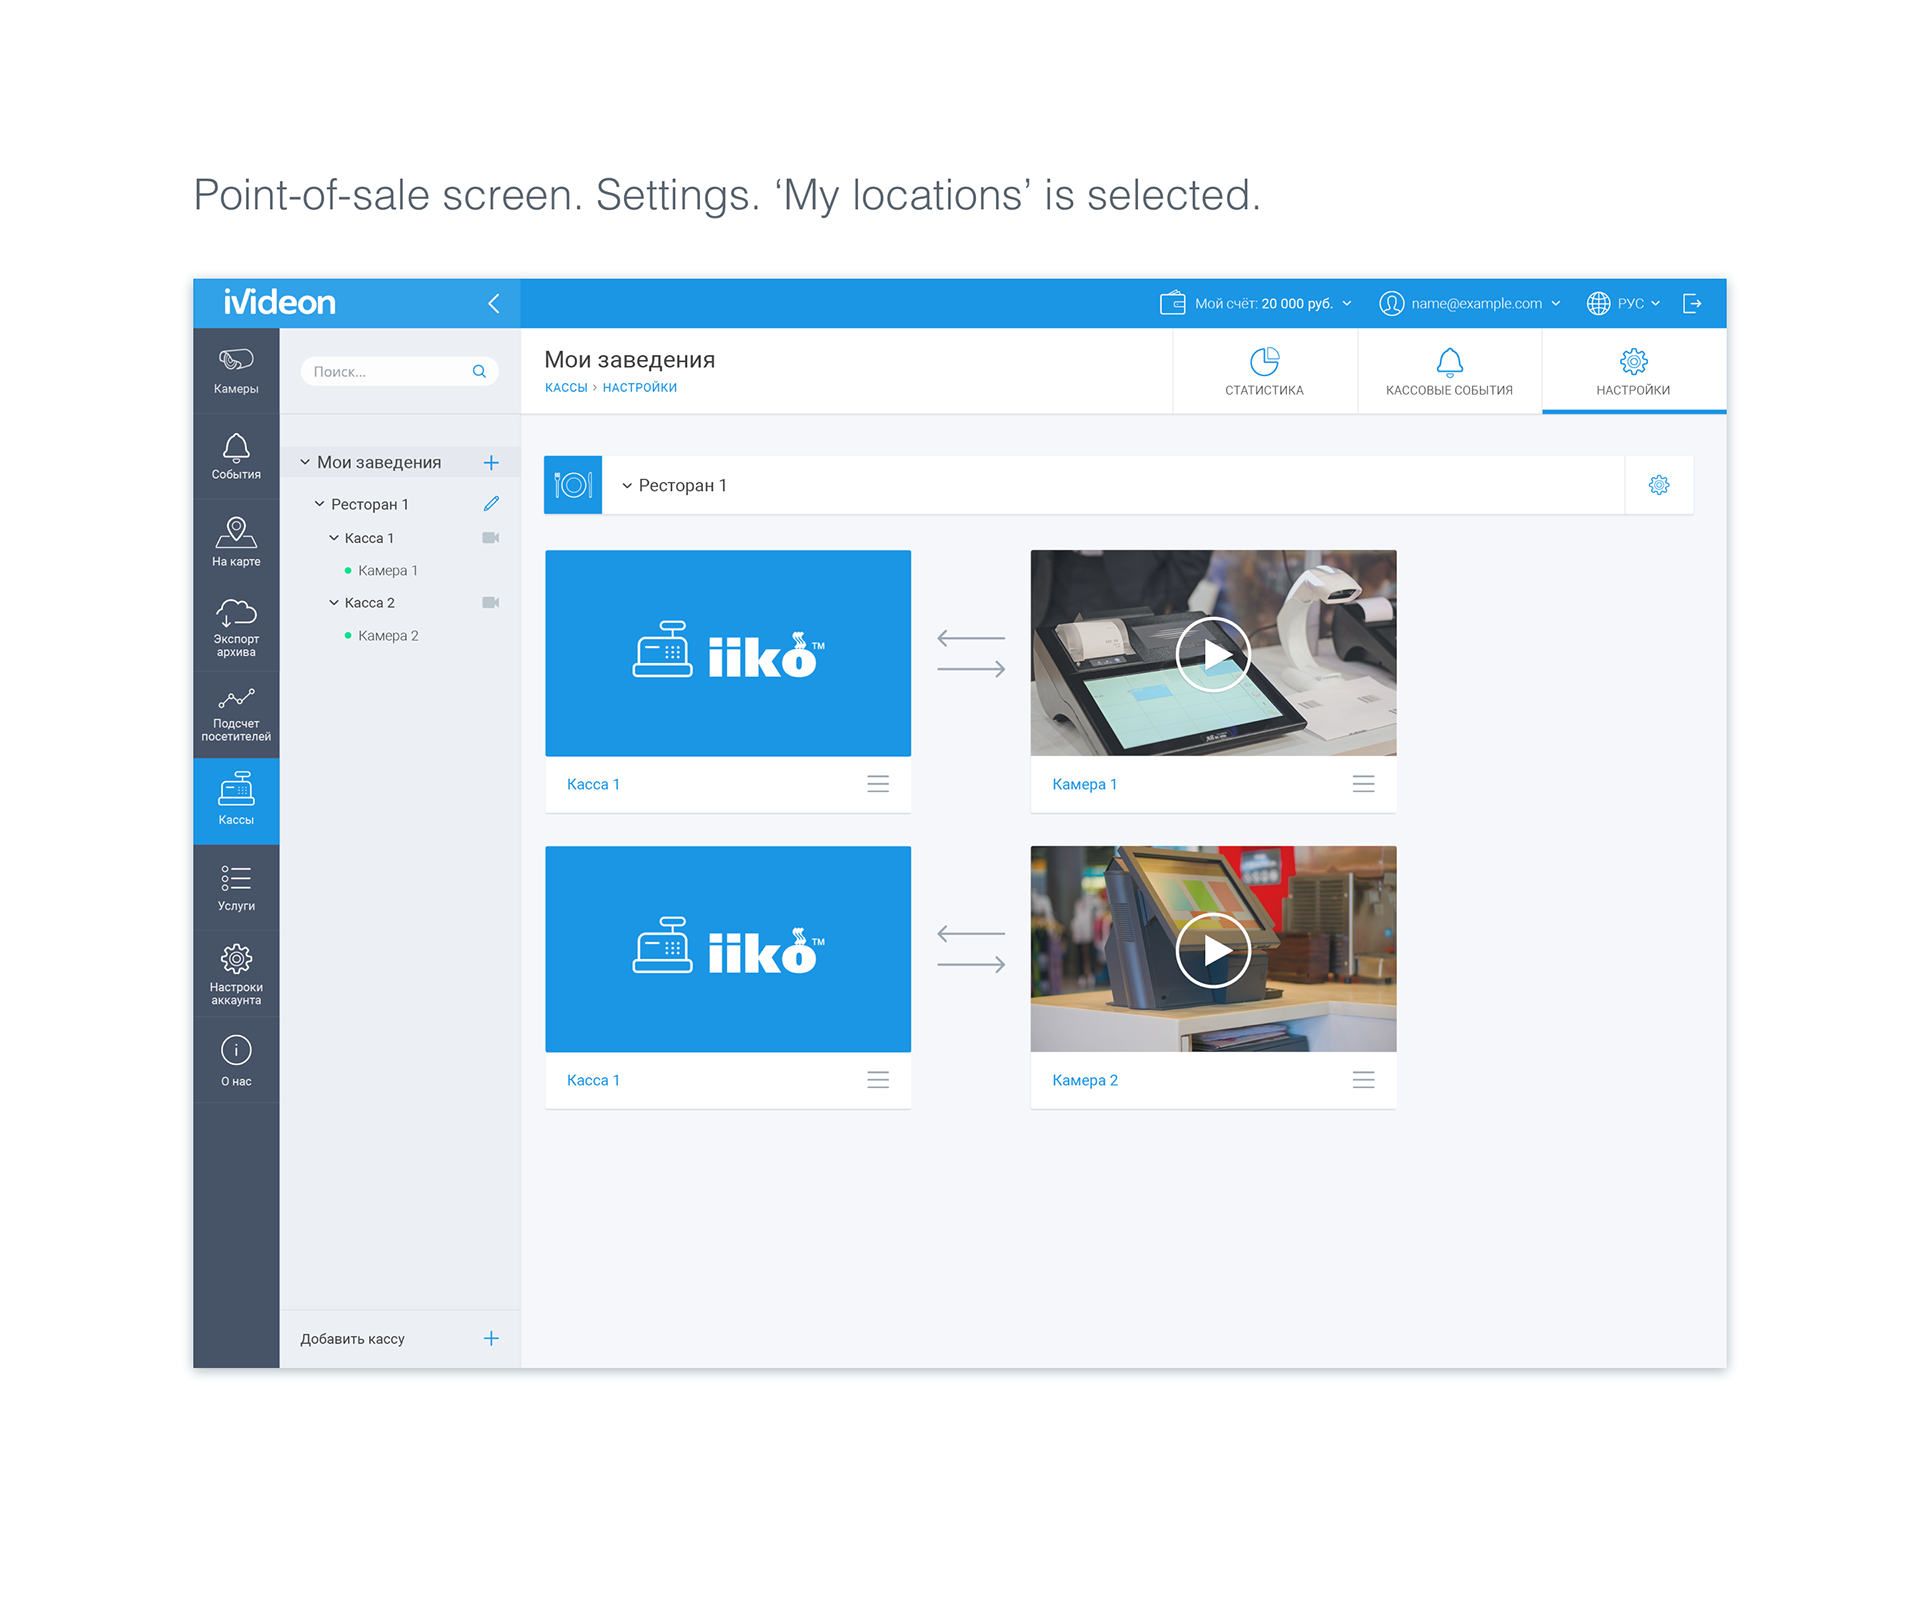
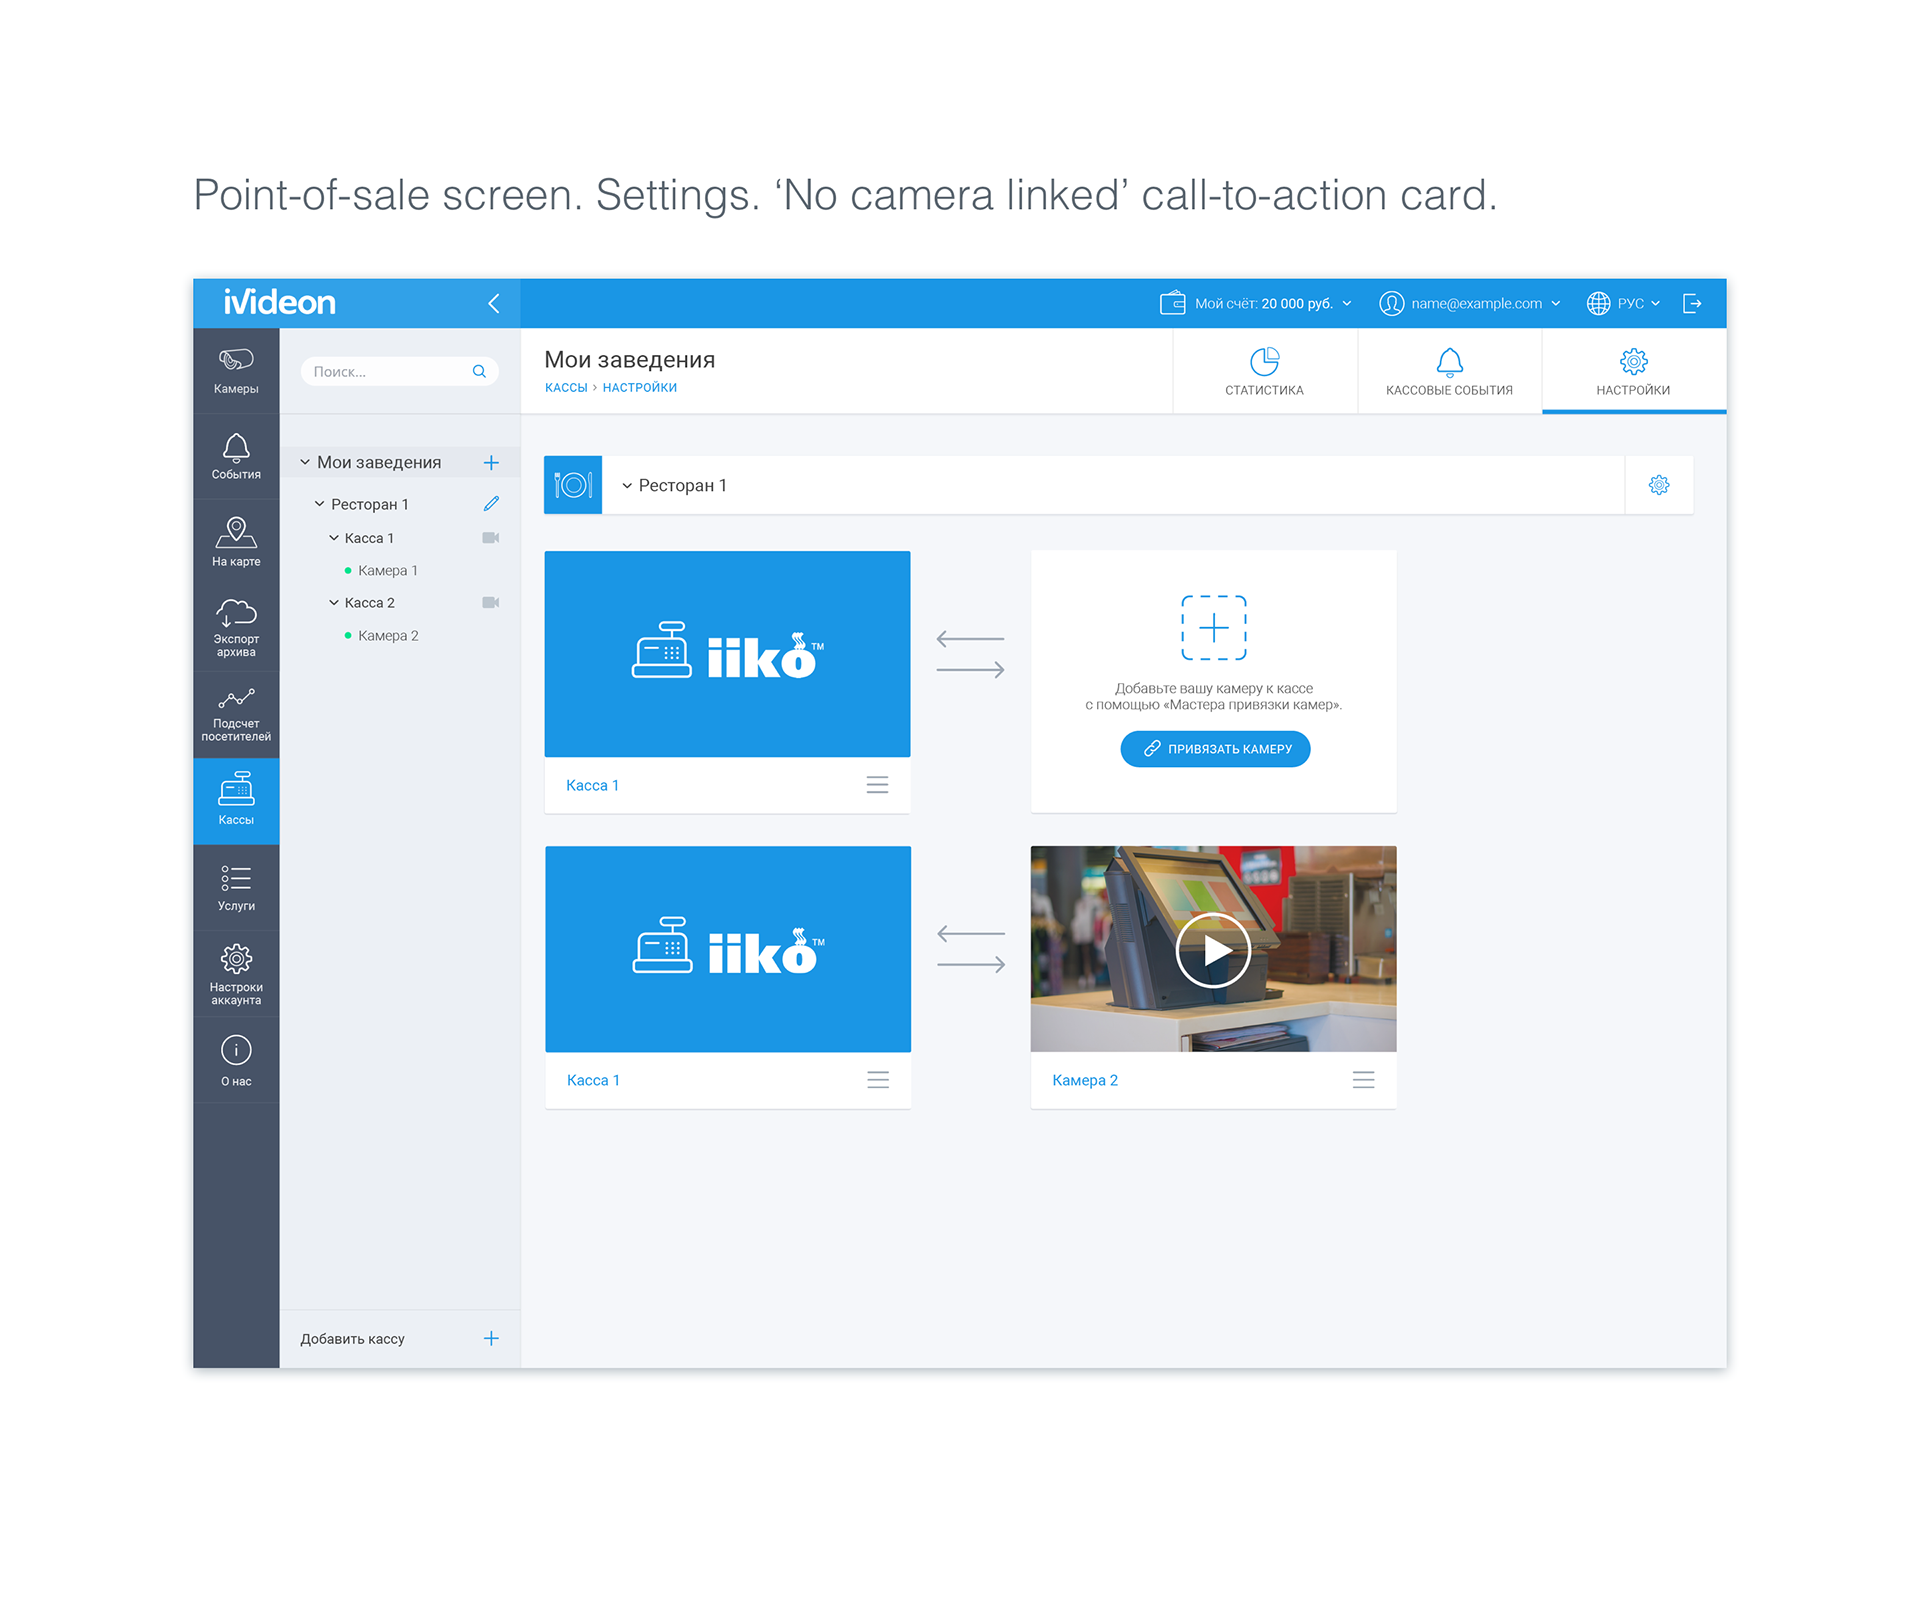
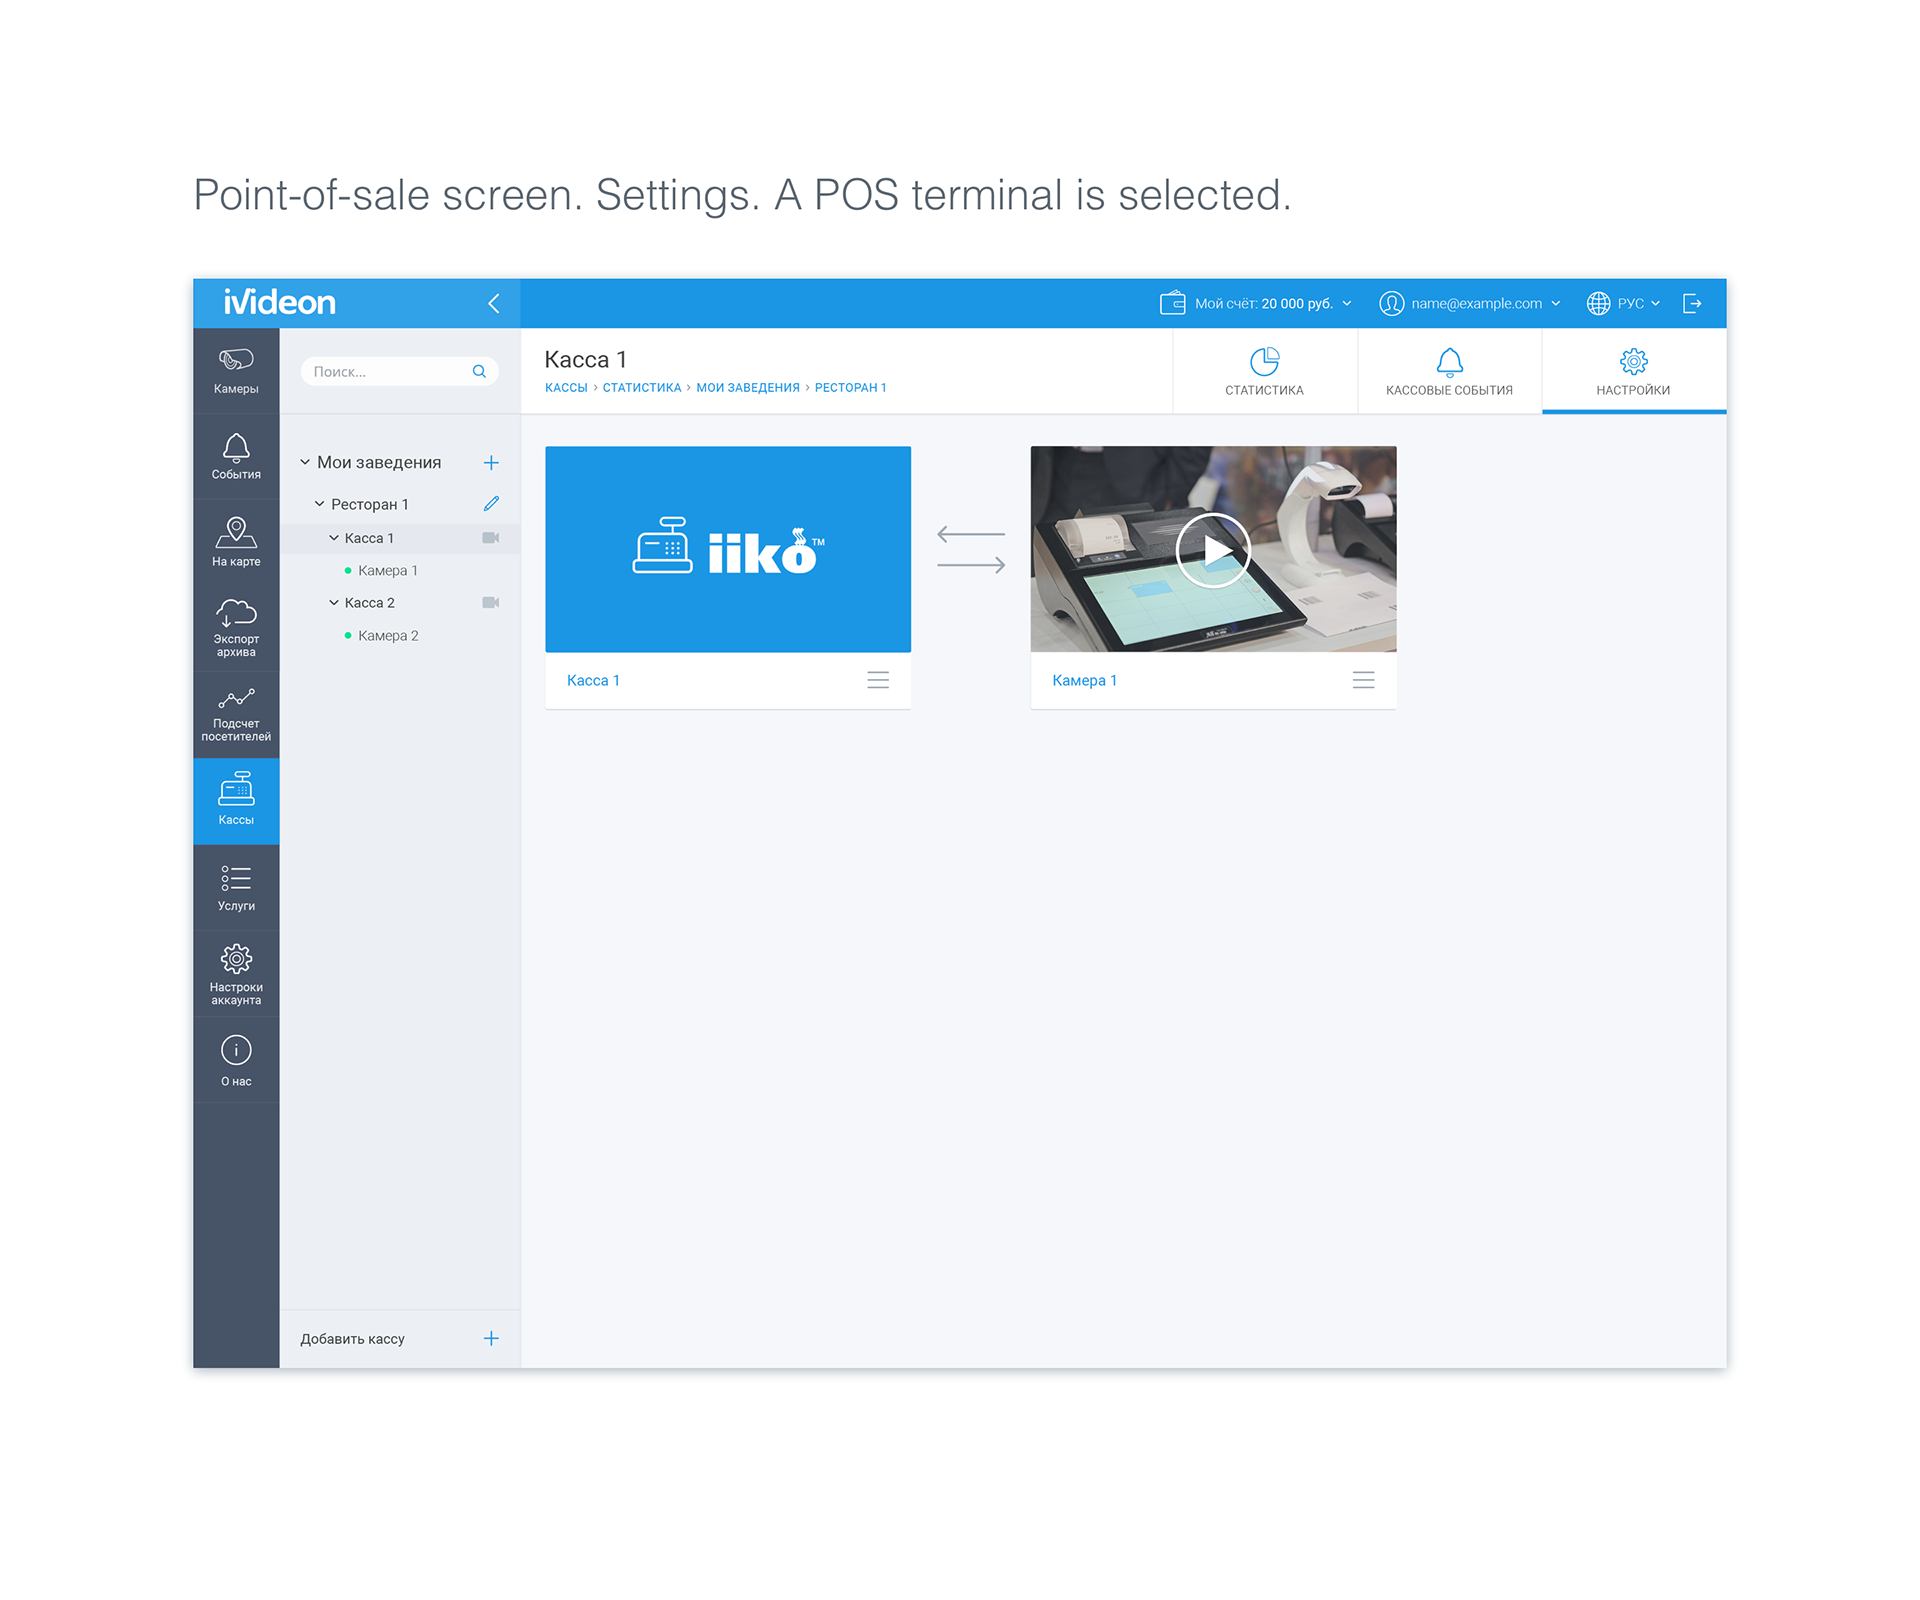
Point-of-Sale Integration (B2B)
Goal: monitor a restaurant or a retail store business performance and violations from a single place, correlate with camera events, live and archive video recordings.
Goal: monitor a restaurant or a retail store business performance and violations from a single place, correlate with camera events, live and archive video recordings.


